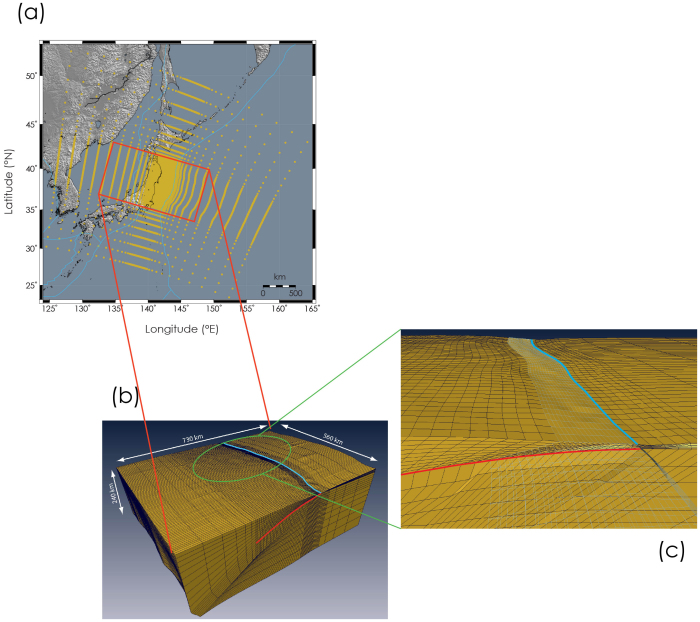
Figure 2. FEM model.
(a) Total domain of the 3D FEM model (~2900 × 2500 km2). Yellow dots represent the free surface grid nodes. (b) Central part of the 3D FEM model, including the active fault, viewed from SW. The light blue line is the trench and the red line is the section of the active fault. (c) The inset shows a zoom of the interface between trench and the uppermost part of the fault. The shaded element edges lines on the top identify the prism extent. Details about the elastic layering of the model can be found in the Supplementary Information, Figure S1. Panel (a) is created using GMT software, panels (b,c) using AMIRA (http://www.vsg3d.com/amira/overview, Date of access: 11/06/2011) software.

