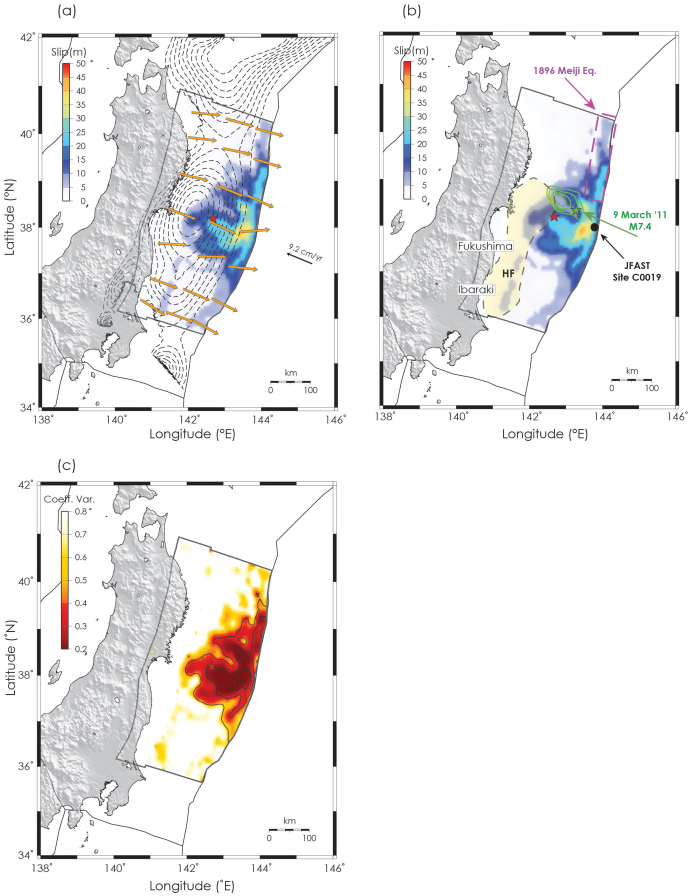
Figure 3. Slip distribution.
Slip distribution for the 2011 Tohoku-oki earthquake obtained from the joint inversion of tsunami and geodetic data. (a) Orange arrows represent the slip direction (rake, Table S3 in Supplementary Information). Thin dashed black contours above the fault plane indicate the interseismic coupling48 (from 10% to 100%, at 10% intervals) along the megathrust. Black arrow indicates the approximate convergence direction of the Pacific plate (estimated velocity of 9.2 cm/yr). Red star as of Figure 1. (b) Green contour lines (intervals are at 0.25, 0.50, 1.00, and 1.50 m) and green star indicate the slip distribution and the epicenter position of the foreshock45 occurred on 9 March 2011, respectively; magenta dashed rectangle represents approximately the rupture area of the 1896 Meiji-Sanriku earthquake2; yellow coloured region approximately indicates the zone of coseismic high frequency radiation; black dot indicates the JFAST ocean drilling site C001923; (c) coefficients of variation associated to the average slip model of the 2011 Tohoku-oki earthquake resulting from the joint inversion. Black contour lines (10meters interval) indicate the slip distribution of Tohoku earthquake. Maps are created using GMT software.

