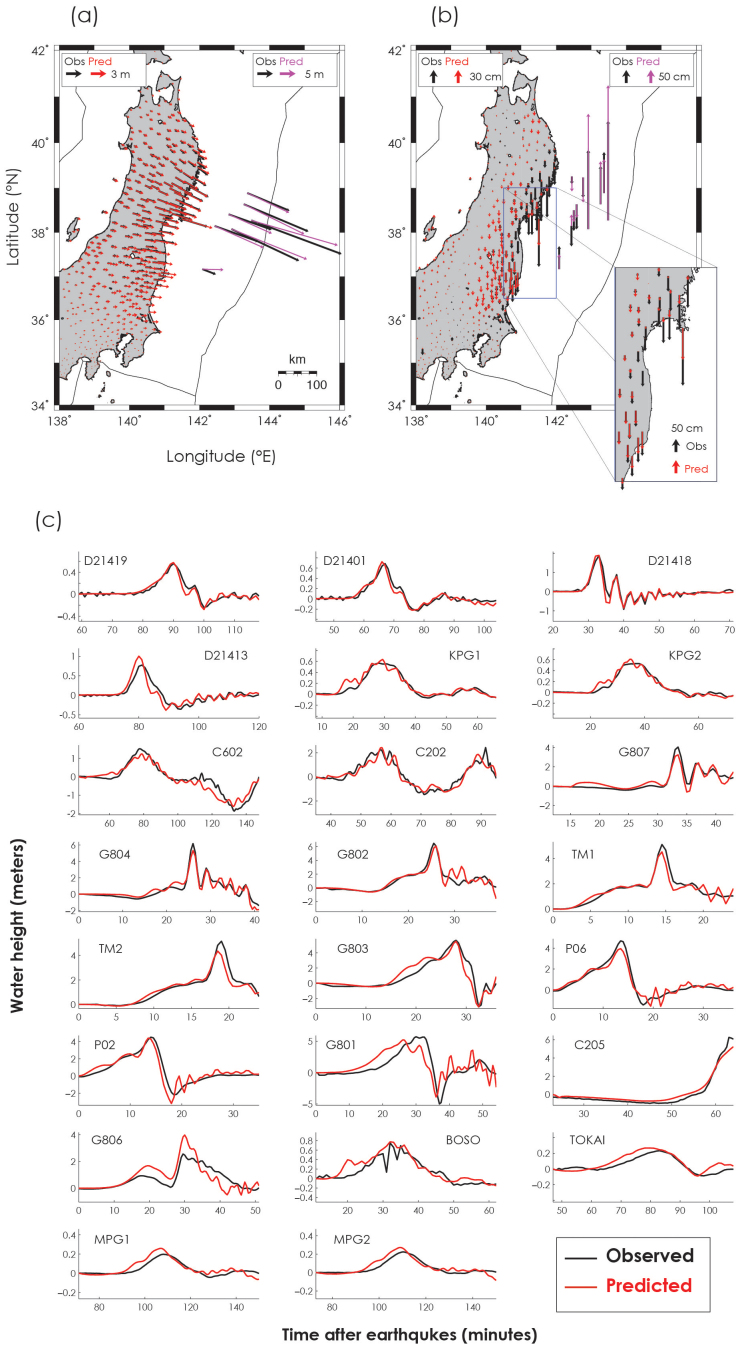
Figure 4. Comparison between observed and predicted data sets.
Comparison between observed (black) and predicted (a) horizontal and (b) vertical displacements at GPS (red) and geodetic seafloor observation sites (magenta). (c) Comparison between the observed (black) and predicted (red) tsunami waveforms. Panels (a,b) are created using GMT software; panel (c) using MATLAB (http://www.mathworks.it/products/matlab/, Date of access: 11/06/2011).

