
Figure 5. Comparison between Slip and Velocity anomaly distributions.
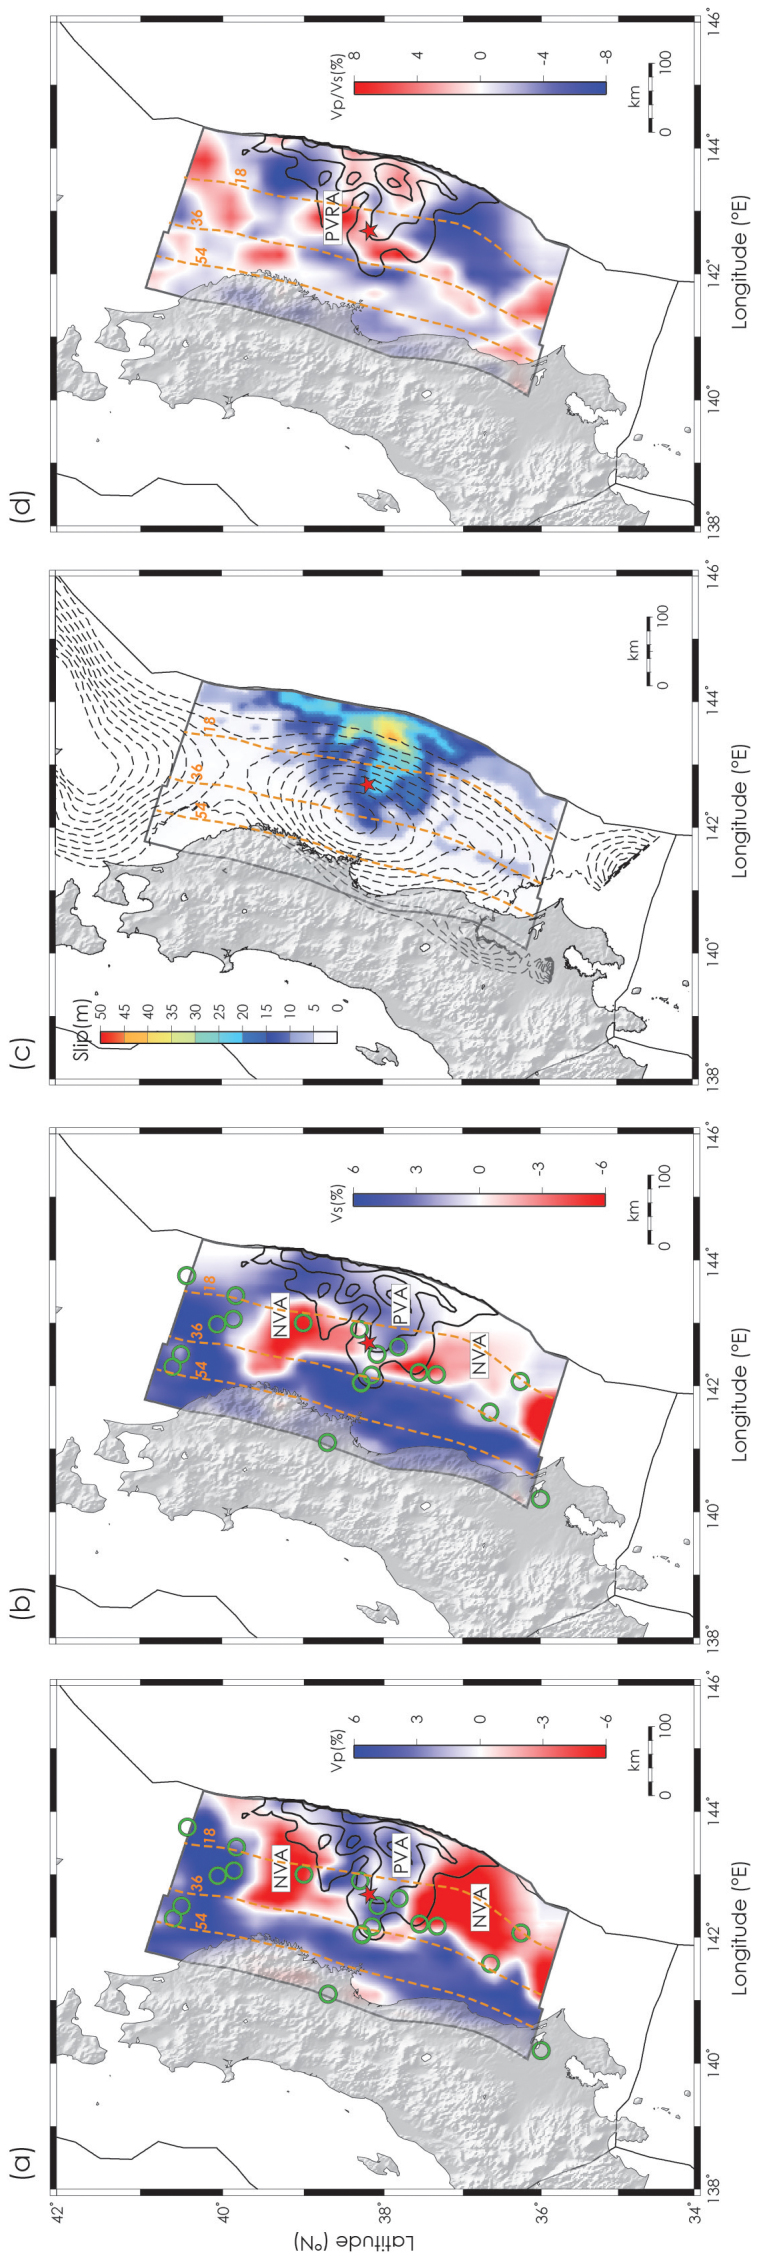
(a) Vp and (b) Vs anomaly distributions29 on the subducting plate interface. Black contour lines (10 m interval) indicate the slip distribution of Tohoku earthquake. Open green circles indicate the large (M > 7) earthquakes occurred in the Tohoku earthquake region since 1900. Orange dashed contour lines (18 km interval) indicate the depth of plate interface. Red star as of Figure 1. (c) Slip distribution for the 2011 Tohoku-oki earthquake. Red star and thin dashed black contours above the fault plane as of Figure 3a; (d) Vp/Vs ratio anomaly distribution on the subducting plate interface. Black contour lines (10 m interval) indicate the slip distribution of Tohoku earthquake. Red star as of Figure 1. Maps are created using GMT software.