
Figure 2.
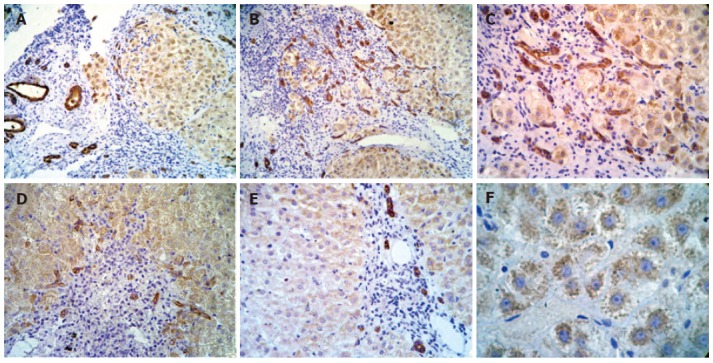
Immunohistochemical analysis of IGF-IR in different samples of liver. A: Strong positive staining in cytoplasm of hepatocytes in all acinar zones (-100 ×); B: strong positive staining in cytoplasmic membrane and cytoplasm of proliferate bile ducts and in cytoplasm of hepatocytes located in all acinar zones (-100 ×); C: strong positive staining in cytoplasmic membrane and cytoplasm of proliferate bile ducts and in cytoplasm of hepatocytes located in all lobular regions (-200 ×); D: strong positive staining in cytoplasmic membrane and cytoplasm of proliferate bile ducts and in cytoplasm of hepatocytes located in all acinar zones (-100 ×); E: strong positive staining in periportal duct cells (-100x); and F: granular pattern of positivity in cytoplasm of hepatocytes in all lobular regions (-400 ×).