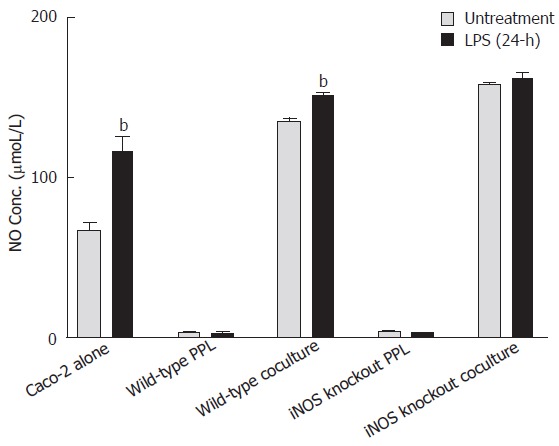
Figure 3.

Comparison of NO release induced by Shigella LPS in various Caco-2 and PPL culture configurations. Shigella LPS was added to five different cultures (set 1: Caco-2 alone; set 2: wild-type PPL only; set 3: Caco-2 and wild-type PPL coculture; set 4: iNOS knockout PPL alone; set 5: Caco-2 and iNOS knockout PPL coculture) and the level of NO release was measured by Griess colorimetric assay and derived based on a standard curve. The black bar and the gray bar represent 24 h treatment with and without LPS, respectively. The values represent the means ± SE for 6-14 different samples. Statistical significance relative to its own un-treatment group was indicated by bP < 0.001.
