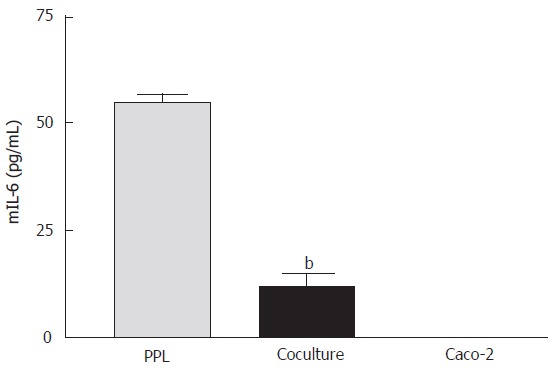
Figure 4.

Suppression of mIL-6 release from PPL by cocultured Caco-2 epithelial cells. The bars (gray: wild-type PPL only; black: coculture of Caco-2 and PPL; white: Caco-2 only control) indicate the level of mIL-6 release 4 d after culture. The level of mIL-6 was measured by mIL-6 ELISA and the values were derived based on a standard curve. The values represent means ± SE; n = 4; bP < 0.001 vs PPL.
