
Figure 1.
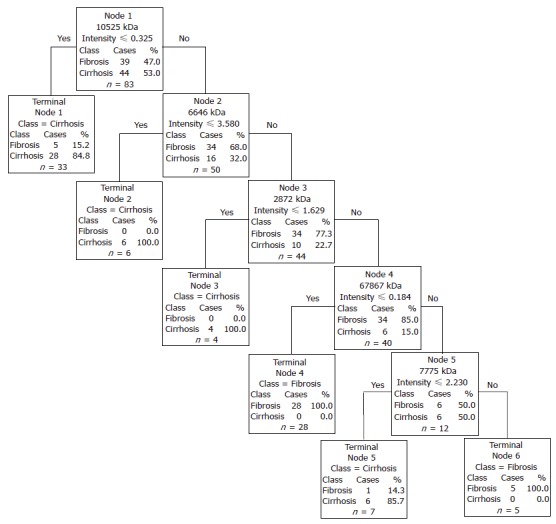
Decision tree for the differentiation of fibrosis versus cirrhosis. The root nodes contain the mass of the selected peak (“node”) which is followed by the intensity value. Samples with intensities lower or equal to the intensity value go to the left terminal node, samples with higher intensities go to the next right descendant nodes.