Figure 1.

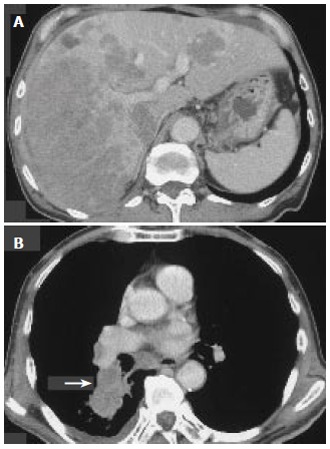
Computed tomography of the patient. A: CT of the abdomen showing multiple lesions and massively infiltrative process throughout the liver parenchyma; B: CT of the chest showing a right hilar mass (arrow) with pleural effusion.

Computed tomography of the patient. A: CT of the abdomen showing multiple lesions and massively infiltrative process throughout the liver parenchyma; B: CT of the chest showing a right hilar mass (arrow) with pleural effusion.