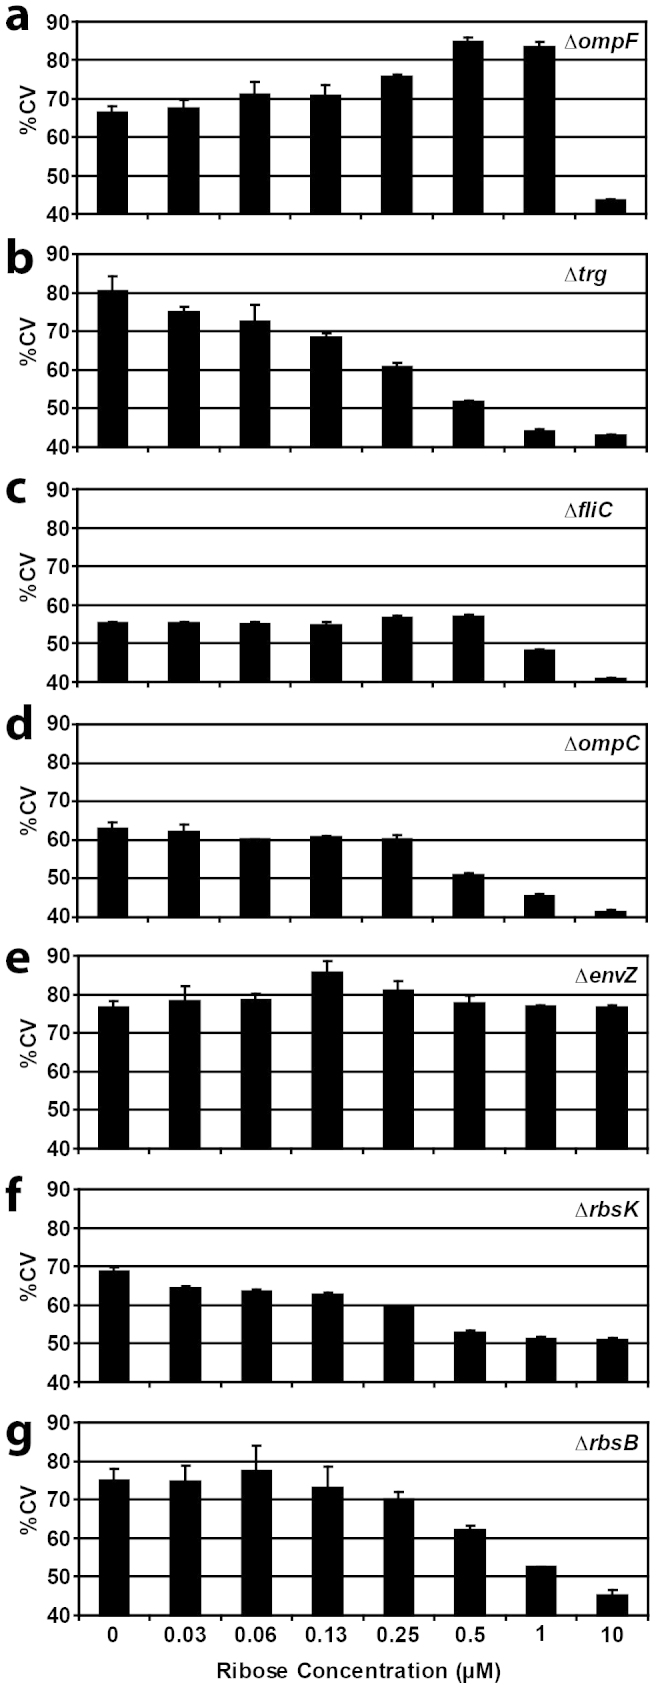
Figure 5. Coefficient of variation of per-cell GFPmut2 expression as a function of ribose concentration for different E. coli BW25113 backgrounds (A–G, Table 2) expressing rbsB-his6 from pAR3 and the TrzI-OmpR-ompCp::gfpmut2 hybrid signaling chain of pSYK1.

Bars indicate the mean coefficient of variation from biological triplicate assays (each measuring GFPmut2 expression in 10,000 cells), plus one calculated standard deviation (error bar).
