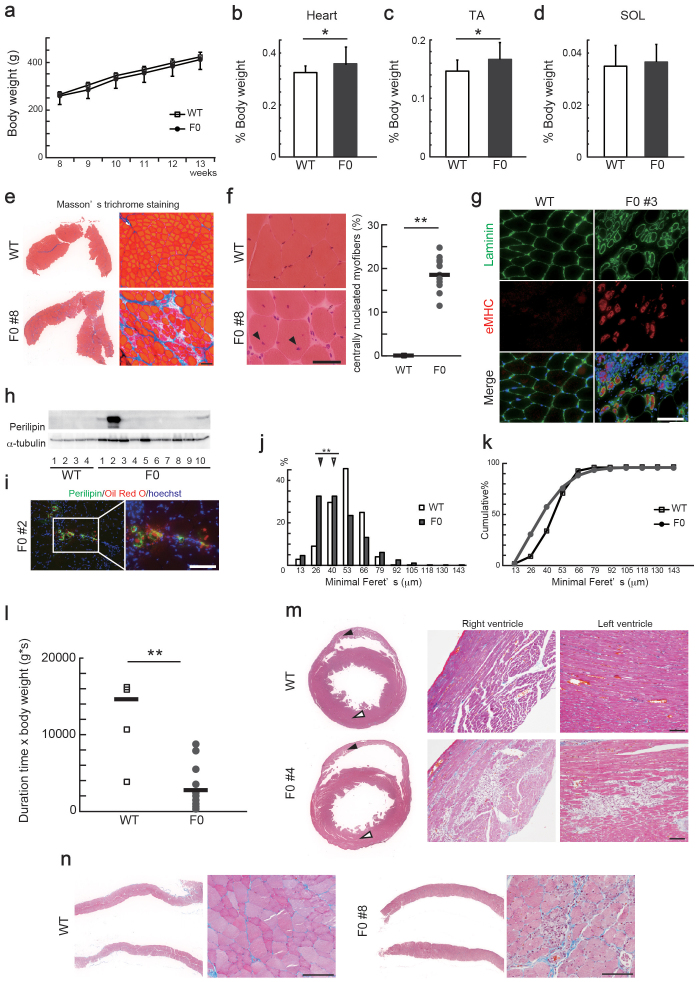
Figure 2. Pathological analyses of Dmd-mutated F0 rats.
(a) Body weight and weights of the (b) heart, (c) tibialis anterior (TA), and (d) soleus (SOL) muscles relative to body weight of Dmd-mutated F0 (n = 10) and age-matched wild type (WT) rats (n = 4). *P < 0.05. (e) Masson's trichrome staining of TA muscles in 13-week-old WT and Dmd-mutated F0 rats. Scale bar = 100 μm. (f) Hematoxylin & eosin (H&E) staining of TA muscles in 13-week-old WT and Dmd-mutated F0 rats. Scale bar = 50 μm. Myofibers with central nuclei were indicated with arrowheads and quantified in the right plots (WT; n = 4, Dmd-mutated F0; n = 10). Bars represent the mean value of each group. **P < 0.01. (g) Cross sections of TA muscles in 13-week-old WT and Dmd-mutated F0 rats stained with anti-laminin (green) and anti-embryonic myosin heavy chain (eMHC, red) antibody. Scale bar = 100 μm. (h) Immunoblotting for Perilipin and α-tubulin in TA muscles of WT and Dmd-mutated rats. Full-length blots are shown in Supplementary Figure 8e and f. (i) Cross sections of TA muscles in 13-week-old WT and Dmd-mutated F0 rats stained with anti-Perilipin antibody (green) and Oil Red O (red). Scale bar = 100 μm. Relative distributions (j) and cumulative plots (k) of myofiber size in TA muscles of 13-week-old WT and F0 rats (WT, 2448 fibers and F0, 6612 fibers). Arrowheads indicate median values. **P < 0.01. (l) Results of wire-hang test in WT (n = 4) and Dmd-mutated F0 (n = 10) rats. Bars represent the mean value of each group. **P < 0.01. Masson's trichrome stainings of (m) hearts and (n) diaphragms of 13-week-old WT and Dmd-mutated F0 rats. Scale bar = 100 μm. Black and white arrowheads indicate right and left ventricles, respectively. Scale bar = 100 μm.

