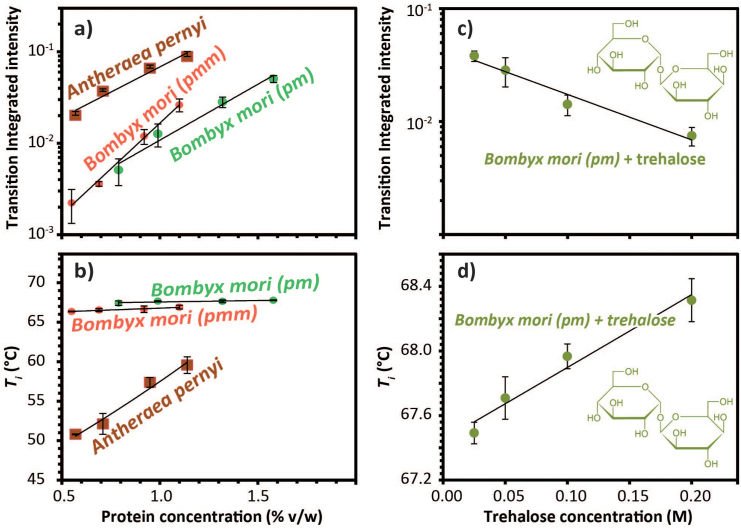
Figure 4. Analysis of DSF Data shown in Figure 3.
(a) Integrated transition intensity as a function of the protein concentration for Antheraea pernyi and Bombyx mori posterior (pm) and middle (pmm). (b) Ti as a function of the protein concentration for Antheraea and Bombyx posterior (pm) and middle (pmm) sections. (c) Integrated transition intensity as a function of trehalose concentration for B. mori posterior section (pm). (d) Ti as a function of the trehalose concentration for B. mori posterior section (pm).

