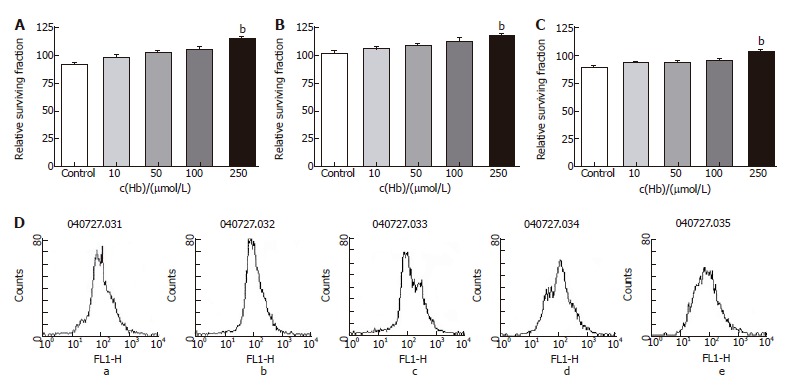
Figure 6.

Relative surviving fraction of cell lines after adding 5-DFUR (1 mg/L) and each concentration of hemoglobin. A: HT-29 cell line. bP = 0.000 vs Control; B: Lovo cell line. bP = 0.006 vs Control; C: CCL-33Co cell line. bP = 0.000 vs Control; D: Flowcytometry of HT-29. a: Hb 0 μmol/L; b: Hb 10 μmol/L; c: Hb 50 μmol/L; d: Hb 100 μmol/L; e: Hb 250 μmol/L.
