
Figure 2.
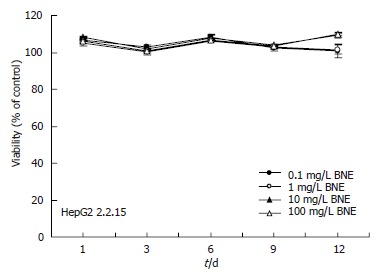
Cytotoxic effects of BNE on HepG2 2.2.15 cells. Data are expressed as mean ± SE of three independent experiments (MTT assay).
Official websites use .gov
A
.gov website belongs to an official
government organization in the United States.
Secure .gov websites use HTTPS
A lock (
) or https:// means you've safely
connected to the .gov website. Share sensitive
information only on official, secure websites.
Cytotoxic effects of BNE on HepG2 2.2.15 cells. Data are expressed as mean ± SE of three independent experiments (MTT assay).