
Figure 3.
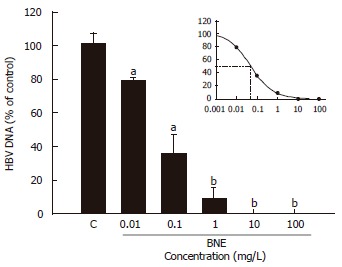
Determination of the effective concentration of BNE anti-HBV activity. Cells were treated for 24 h. Data are expressed as mean ± SE of three independent experiments. aP < 0.05, bP < 0.01 vs the corresponding controls (Student’s t-test).
Official websites use .gov
A
.gov website belongs to an official
government organization in the United States.
Secure .gov websites use HTTPS
A lock (
) or https:// means you've safely
connected to the .gov website. Share sensitive
information only on official, secure websites.
Determination of the effective concentration of BNE anti-HBV activity. Cells were treated for 24 h. Data are expressed as mean ± SE of three independent experiments. aP < 0.05, bP < 0.01 vs the corresponding controls (Student’s t-test).