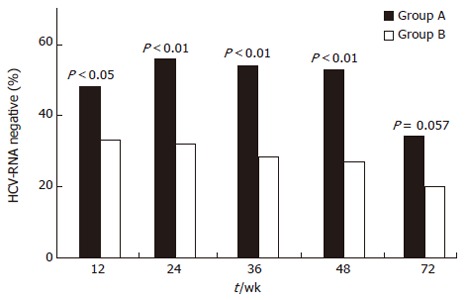
Figure 2.

Comparison of virologic responses over time in patients treated with peginterferon plus ribavirin and amantadine (Group A), and with standard interferon plus ribavirin and amantadine (Group B). Percentages of patients negative for HCV-RNA during and after therapy with peginterferon plus ribavirin and amantadine (black bar) or standard interferon plus ribavirin and amantadine (white bar) are shown. Significance between the two treatments is shown at each time interval.
