Figure 3.

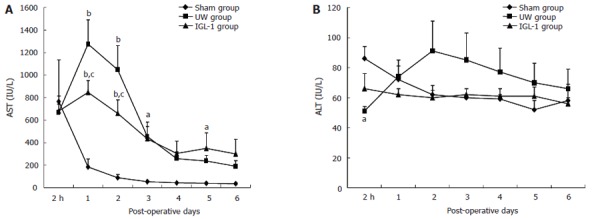
Serum aspartate aminotransferase (A) and alanine aminotransferase (B) activities after liver transplantation. Data are expressed as mean ± SE. aP < 0.05 vs sham; bP < 0.01 vs sham; cP < 0.05 vs UW.

Serum aspartate aminotransferase (A) and alanine aminotransferase (B) activities after liver transplantation. Data are expressed as mean ± SE. aP < 0.05 vs sham; bP < 0.01 vs sham; cP < 0.05 vs UW.