
Figure 1.
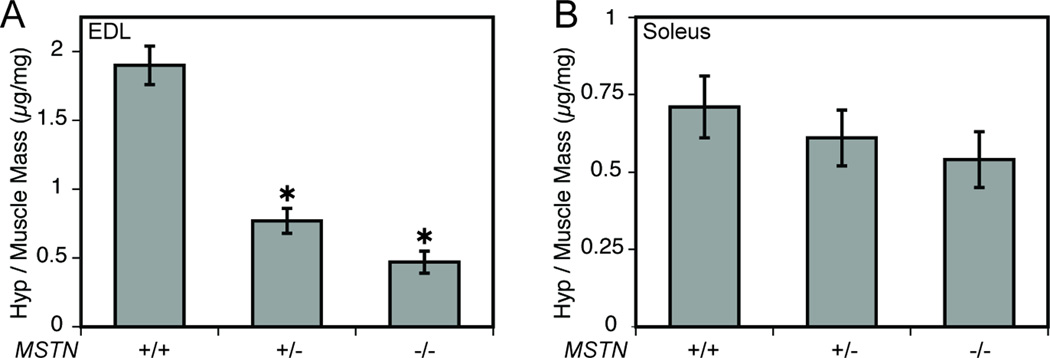
Relative hydroxyproline content of EDL (A) and soleus (B) muscles from MSTN+/+, MSTN+/− and MSTN−/− mice. (A) Compared with MSTN+/+ mice, the amount of hydroxyproline per mg of dry EDL muscle mass was less for MSTN+/− and MSTN−/− mice. (B) There was no difference in the amount of hydroxyproline per mg of dry soleus muscle mass between MSTN+/+, MSTN+/− and MSTN−/− mice. Values are means ± SE. N = 5 muscles per genotype. *Significantly different from MSTN+/+ at P < 0.05.