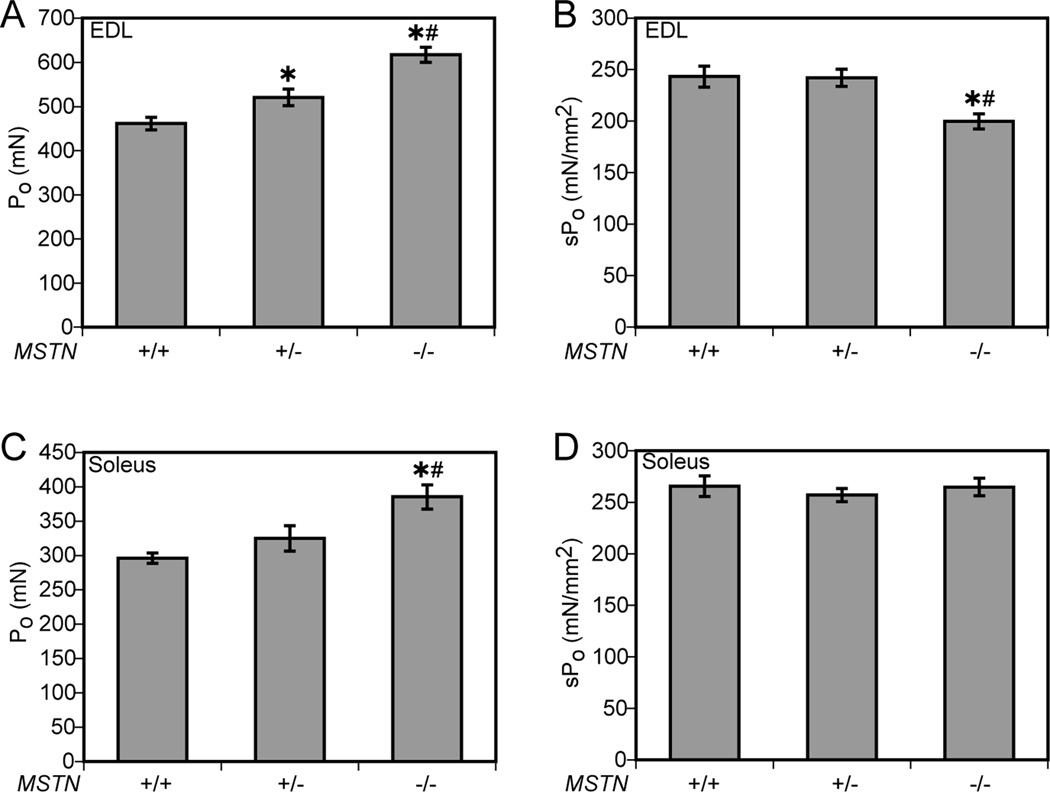
Figure 3.
Force values for EDL muscles (A, B) and soleus muscles (C,D) from MSTN+/+, MSTN+/− and MSTN−/− mice. (A) The Po of EDL muscles of MSTN−/− mice is greater than the Po of MSTN+/+ and MSTN+/− mice. (B) When Po is normalized to CSA, the sPo of EDL muscles of MSTN−/− mice is less than the sPo of MSTN+/+ and MSTN+/− mice. (C) The Po of soleus muscles of MSTN−/− mice is greater than the Po of MSTN+/+ and MSTN+/− mice. (D) When Po is normalized to CSA, there is no difference in sPo of soleus muscles. Values are means ± SE. N = 6 muscles per genotype. *Significantly different from MSTN+/+ at P < 0.05. #Significantly different from MSTN+/− at P < 0.05.

