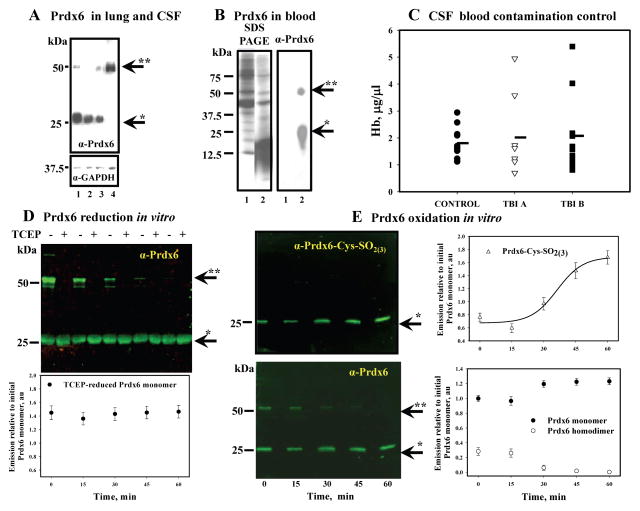
Fig. 3. Prdx6 detection in CSF, blood, its oxidation by H2O2 in vitro and CSF blood contamination control.
Panel A: comparison of Prdx6 level in: 1- lung homogenate; 2- TBI CSF; 3 - TBI CSF; 4- control CSF (all lanes contained 20.0 μg of total protein). Panel B: Prdx6 detection in: 1 – plasma (see Materials and Methods) and 2 - RBC lysates from the blood of control patients (SDS PAGE is presented as loading control, 20.0 μg protein per lane). Panel C: dot plot of Hb content in the CSF of control (n=9) and TBI (nTBI A=8, nTBI B=10) patients. Panel D: purified Prdx6 (1.0 μg) monomerization as a result of continuous incubation with 4.0 μM of H2O2 at 37°C in vitro. TCEP reduction of disulfide-based Prdx6 homodimer and quantification (Odyssey Clx, Image Studio 3.1 software) of total reduced monomer normalized for initial (starting material) monomer content before reduction. Panel E: purified Prdx6 (0.5 μg) overoxidation (upper panel, Ab against Prdx6-SO2(3)H) and monomerization (lower panel, same blot with Ab against Prdx6) as a result of its continuous incubation with 2.5 μM of H2O2 at 37°C in vitro. Quantification of Prdx6 overoxidation was fit with sigmoid curve using SigmaPlot 10.0 (SyStat, MA). Quantification of Prdx6 monomeric and dimeric forms was done similar to that in panel D. Data presented as mean±SD for 3 independent experiments. Arrows indicate monomeric (*) and dimeric (**) forms of Prdx6.

