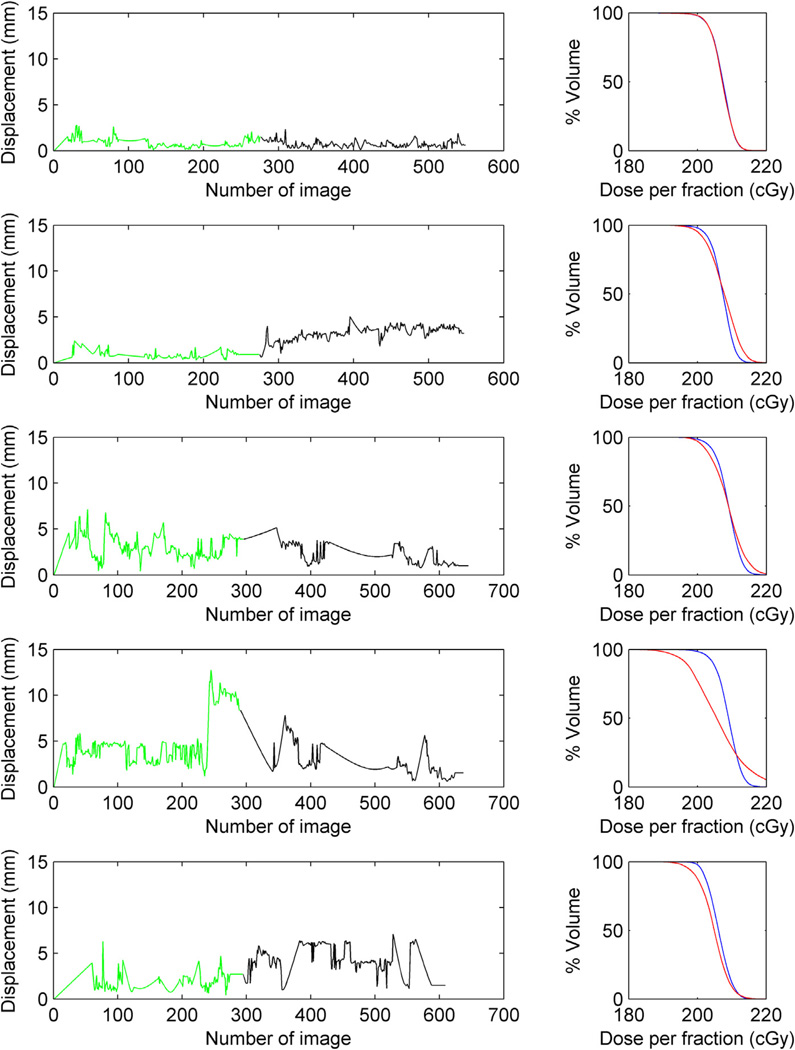
Figure 2.
Gross tumor volume dose-volume histogram (DVH) degradation for 5 different prostate trajectories measured in 3 different patient treatments. The green and black lines represent the trajectories for the 2 volumetric modulated arc therapy arcs. If the beam targeting is good (row 1), no significant degradation is seen in the DVH (planned DVH depicted in blue and delivery DVH depicted in red in the right column). In all the other trajectories, motion has an impact on the absorbed dose in the GTV (prostate).

