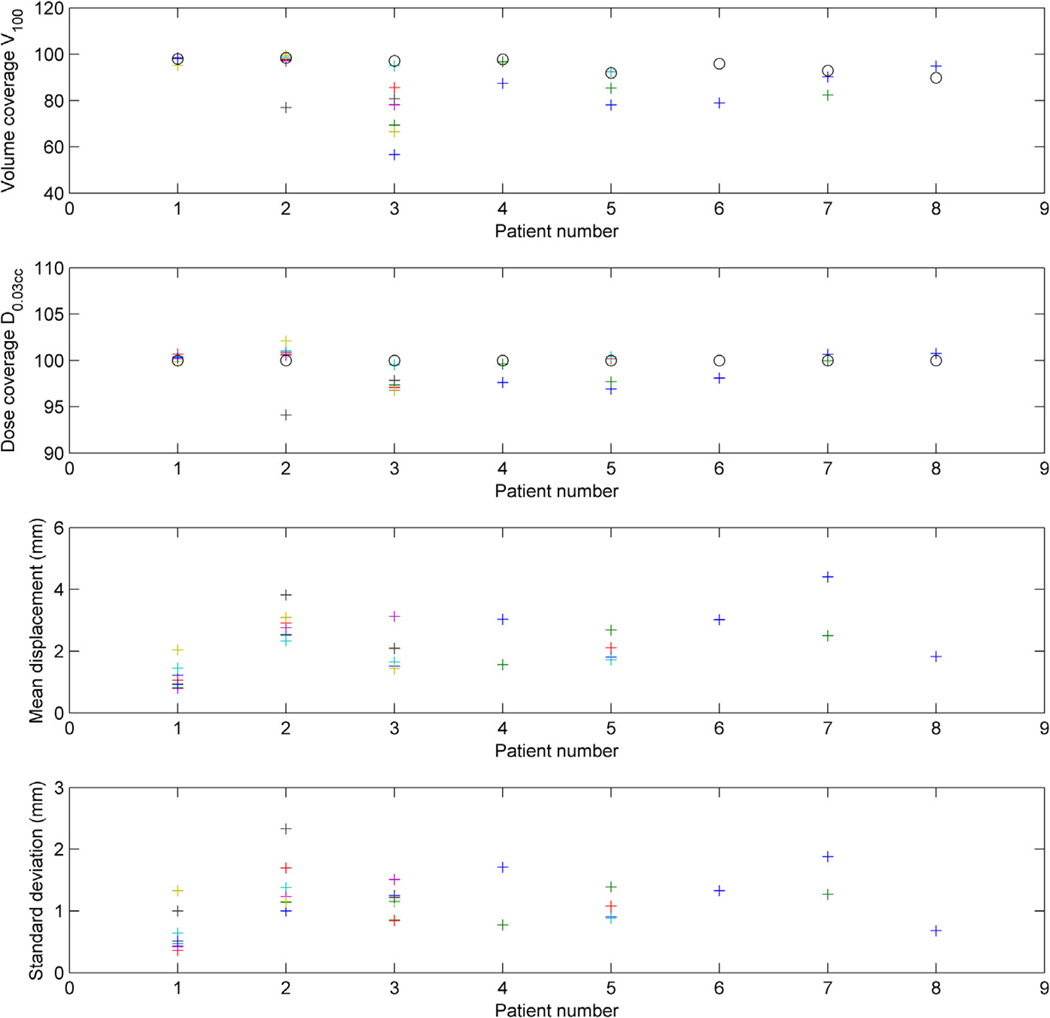
Figure 3.
Volume covered by the prescription dose (V100%, first row), minimum dose that irradiates 0.03 cm3 of the volume (D0.03cc, second row) normalized to the planned D0.03cc as 100% reference, and mean displacement along the treatment fraction for each fraction (third row) with its standard deviation. The circles in the 2 upper rows represent the planned values, and the crosses the actual values for each of the fractions, for the 8 patients.

