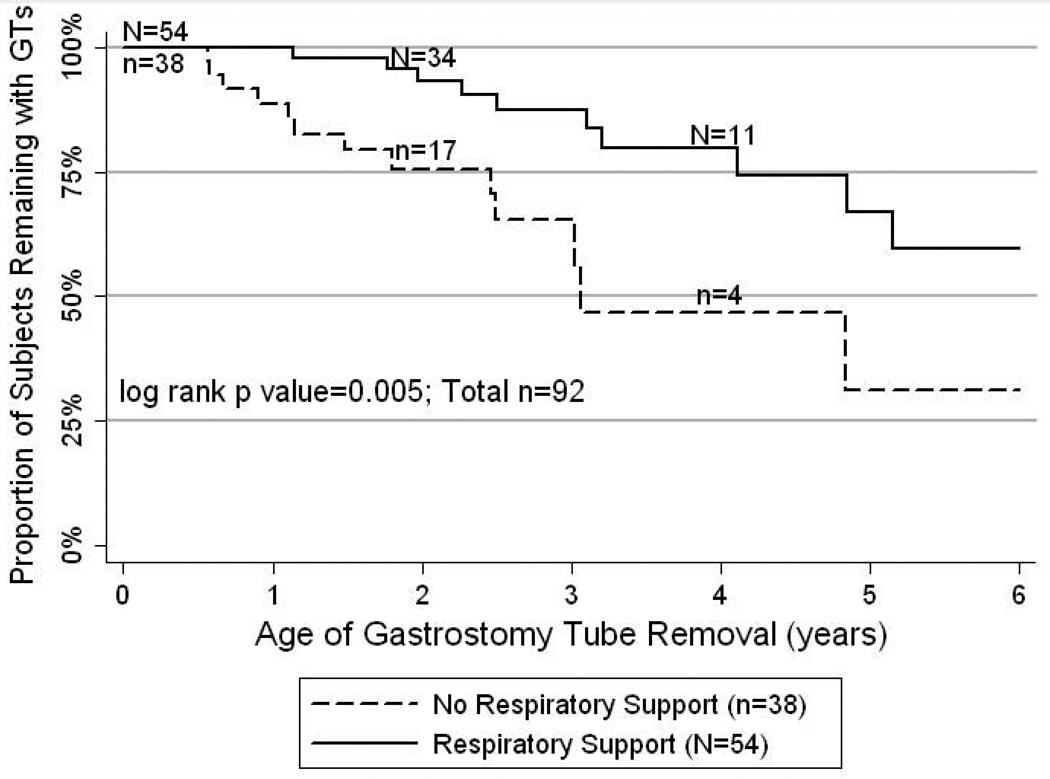
Figure 2.
Age of Gastrostomy Tube Removal (Years): Kaplan-Meier plot demonstrating the age of GT removal for 92 subjects. For 24 subjects the exact date of removal is known and for the remaining 68, the data has been censored as 61 subjects still have a GT in place and 7 have been lost to follow-up prior to GT removal. The solid line represents 54 subjects who were discharged from the NICU on respiratory support at home (supplemental oxygen and/or mechanical ventilation) and the dashed line represents 38 subjects who were discharged without such support. The lines are statistically different (log rank p=0.005). The numbers above the solid line and below the dashed line represent the subjects with follow-up data at that particular age for each respective line.

