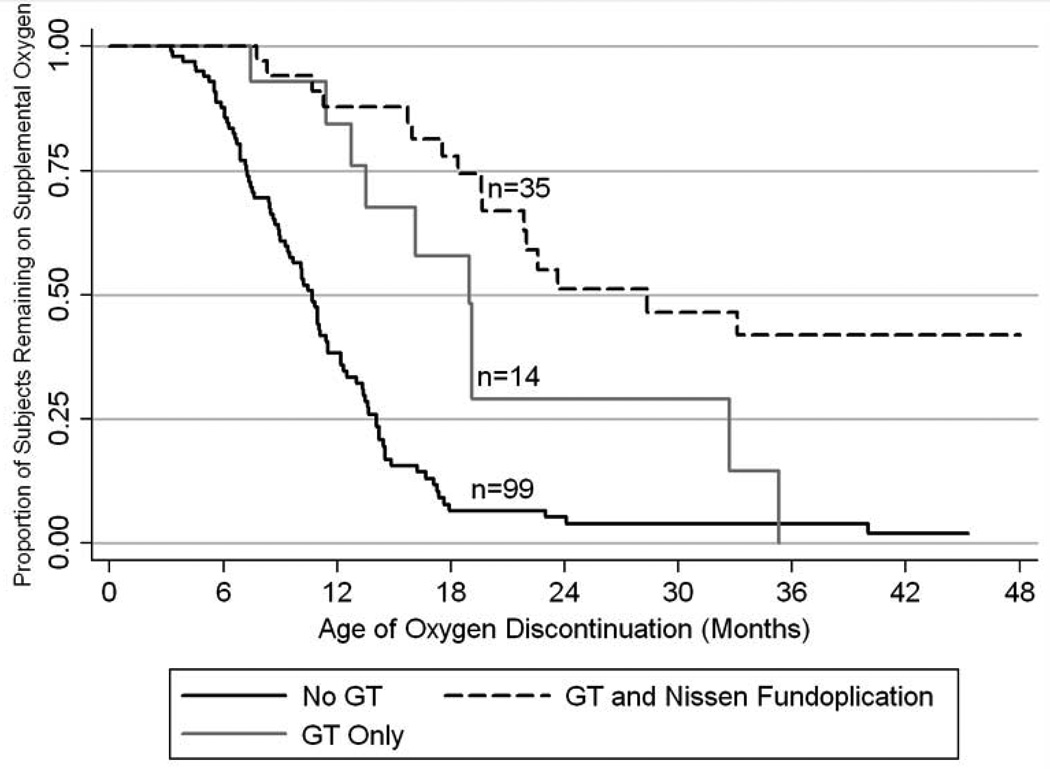
Figure 3.
Age of Oxygen Discontinuation (Months): Kaplan-Meier plot demonstrating the age of weaning off supplemental oxygen for 148 subjects. The solid black line represents 99 subjects without GTs who were discharged from the NICU on supplemental oxygen. The solid gray line represents 14 subjects with GTs who were discharged from the NICU on supplemental oxygen. The solid gray line represents 35 subjects with GTs and Nissen fundoplications who were discharged from the NICU on supplemental oxygen (n=31) or oxygen entrainment via ventilator (n=4). All three plotted lines are statistically different from one another, specifically log rank p values are 0.002 for no GT vs. GT only, <0.001 for no GT vs. GT with Nissen, and 0.025 for GT only vs. GT with Nissen.

