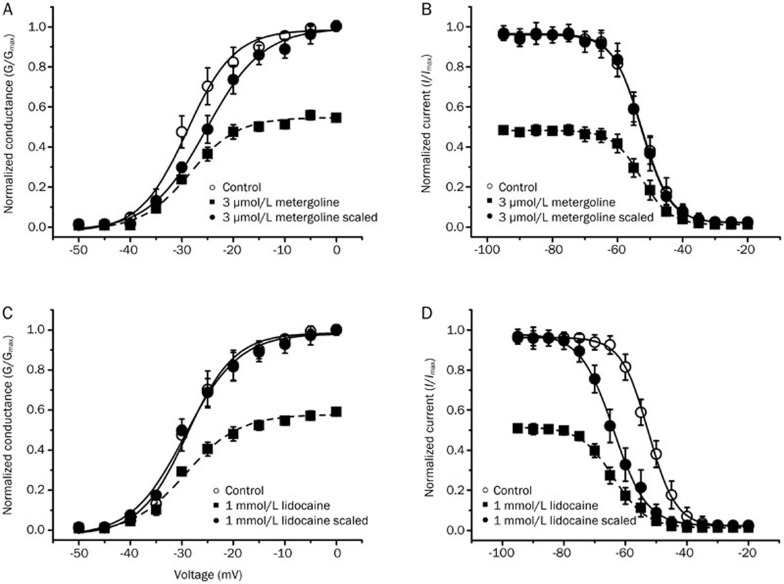
Figure 3.
The effect of metergoline and lidocaine on the steady-state activation and inactivation of the Nav1.2 channel current. (A and C) Effect of metergoline or lidocaine on the steady-state activation and inactivation of Nav1.2 channel current was examined as described in a previous report15. In brief, the voltage-dependence of Na+ channel activation was calculated by measuring the peak current at test potentials ranging from −50 mV to +10 mV evoked in 5 mV increments. The voltage-dependence of conductance was compared in the absence (○) or presence (▪) of 10 μmol/L metergoline or 1 mmol/L lidocaine. The conductance curve in the presence of metergoline or lidocaine is scaled to the maximum conductance (•). Inactivation was measured using a two-pulse protocol in which oocytes were held at −100 mV and depolarized to potentials from −90 mV to −20 mV for 500 ms, followed by a test-pulse to −10 mV for 10 ms to determine channel availability. Inactivation curves are shown in the absence (○) or presence (▪) of 10 μmol/L metergoline or 1 mmol/L lidocaine. Inactivation curves in the presence of metergoline or lidocaine are scaled to the maximum (•). The data represent the mean±SEM (n= 8–10/group). The curves represent a two-state Boltzmann function as described in the Materials and methods section.

