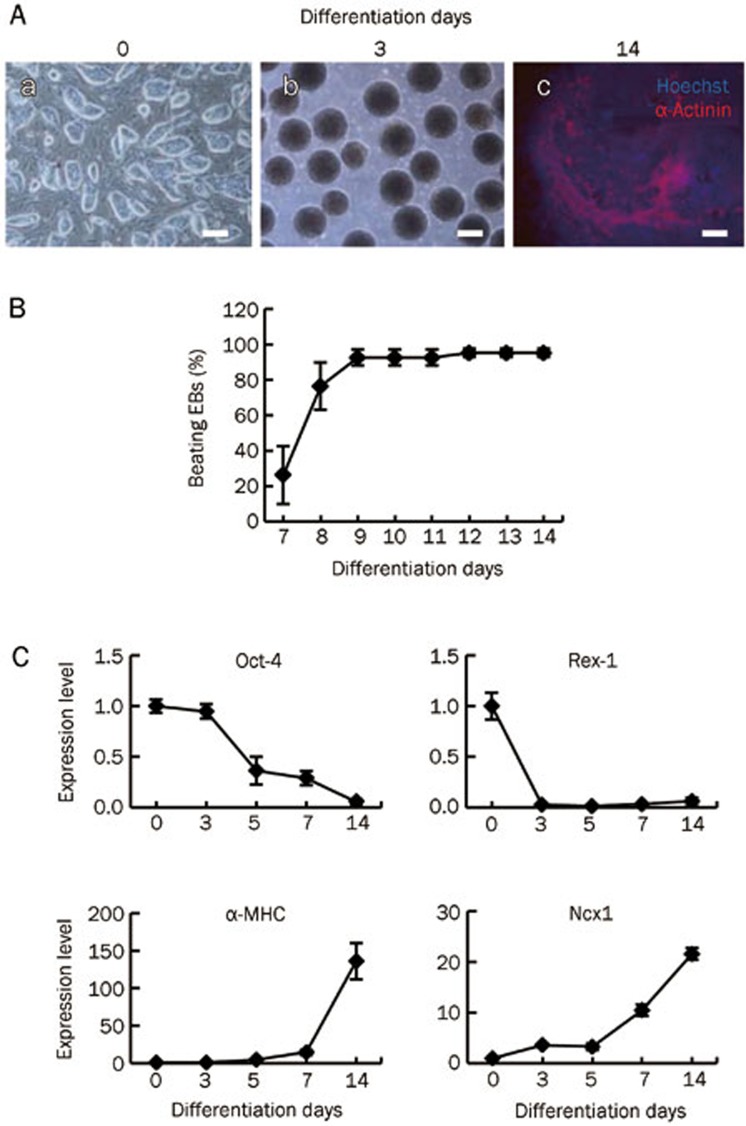
Figure 1.
Differentiation of mESCs into spontaneous beating cardiomyocytes in vitro. (A) mESCs during differentiation d 0 to d 14. (a) Phase contrast image showed undifferentiated mESCs colonies on mitomycin C-inactivated MEFs. (b) Phage contrast image of d 3 EBs suspend in differentiation medium. (c) Immunostaining analysis of α-sarcomeric actinin in d 14 EBs. Bar=200 μm. (B) Differentiation profile of cardiomyocytes during EB outgrowth. EBs were plated on d 6 and checked for beating clusters during differentiation d 7 to d 14. (C) Quantitative expression analysis of pluripotency markers Oct-4 and Rex-1; cardiac specific markers α-MHC and Ncx1 during mESCs differentiation. Ct values of Q-PCR analysis were normalized against GADPH. Data are represented as mean±SEM from at least three independent experiments.

