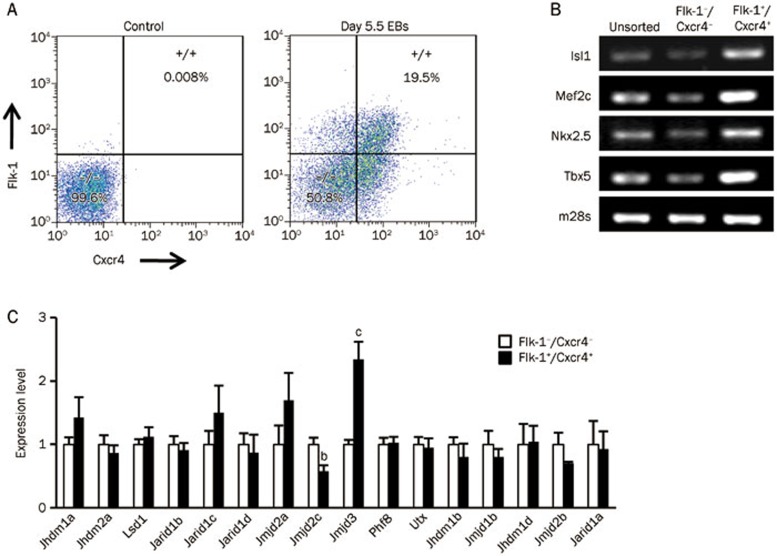
Figure 4.
Characteristics of KDMs in Flk-1+/Cxcr4+ cardiac progenitor cells. (A) FACS sorting of Flk-1−/Cxcr4− and Flk-1+/Cxcr4+ subpopulations at d 5.5. (B) RT-PCR analysis of cardiac marker expression in unsorted, Flk-1−/Cxcr4− and Flk-1+/Cxcr4+ cells. (C) Quantitative expression analysis of KDMs between Flk-1−/Cxcr4− and Flk-1+/Cxcr4+ subpopulations. Data are represented as mean±SEM from at least three independent experiments. bP<0.05, cP<0.01 compared with corresponding Flk-1−/Cxcr4− values.

