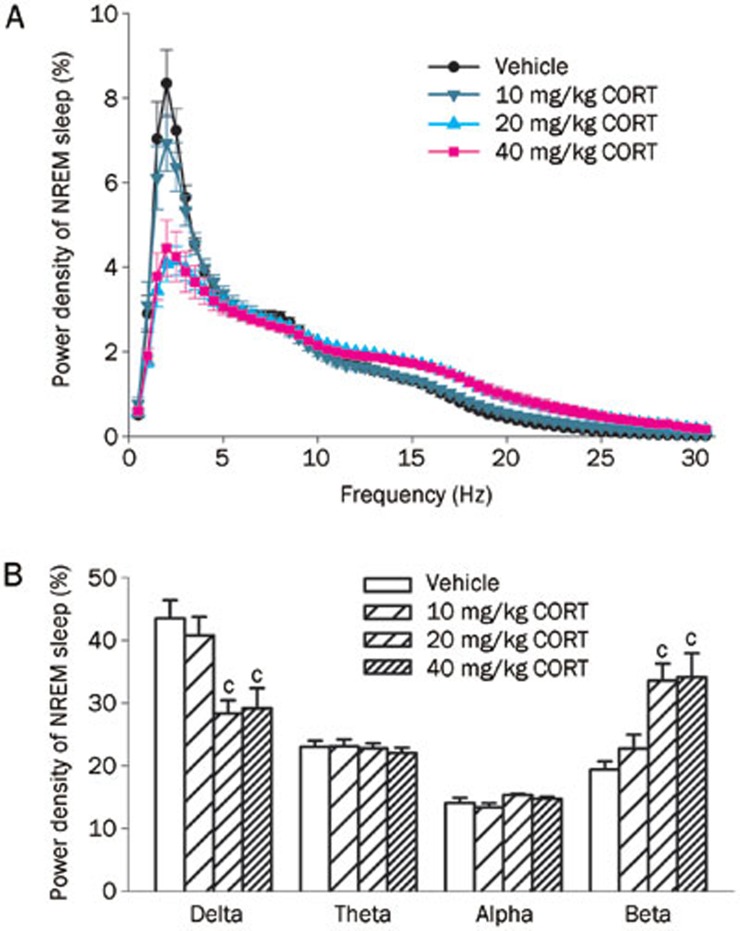
Figure 3.
Effects of a 7-d administration of CORT on EEG spectral power during NREM sleep. (A) The power of each 0.5 Hz bin was first averaged across the sleep stages individually and then normalized by calculating the percentage of each bin from the total power (0–30 Hz) of each animal; (B) Power density of delta (0–4 Hz), theta (4–8 Hz), alpha (8–12 Hz) and beta bands (12–30 Hz) were examined. Data are represented as the mean±SEM. n=6/group. cP<0.01 vs control.

