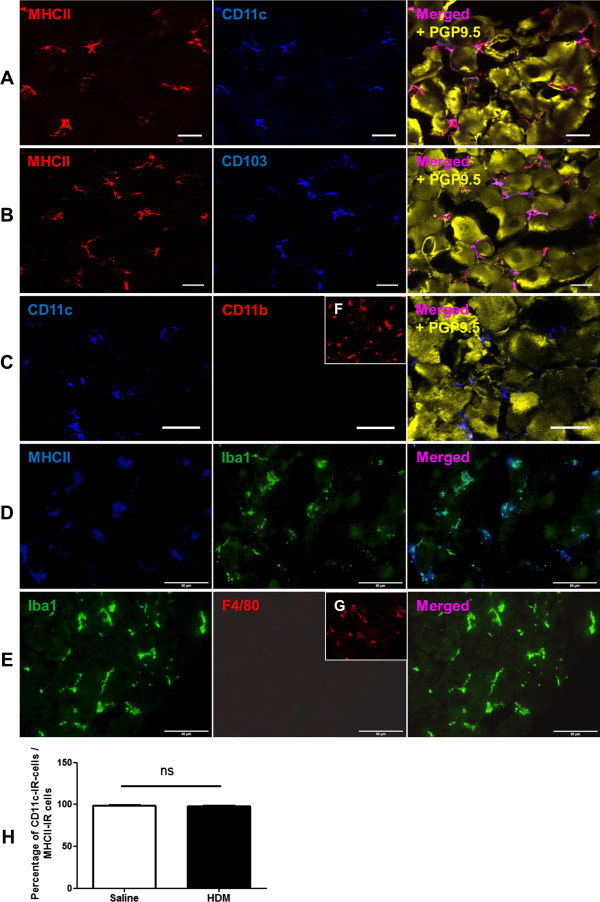
Figure 4.

Phenotypic characterisation of DCs in JNC. JNC sections were stained for different cell markers and images were acquired with confocal microscope LSM 510 META (Carl Zeiss, Jena, Germany) using a 40x objective and Olympus BX51 (Tokyo, Japan) using a 20x, 40x objectives. The Immunofluorescence analysis showed the immune cells in JNC positive for MHC II and CD11c (A), positive for MHC II and CD103 (B), positive for CD11c and negative for CD11b (C), positive for MHC II and Iba1 (D), positive for Iba1 and negative for F4/80 (E). F: Positive control of CD11b antibody in the lung tissue. G: Positive control of CD11c antibody in trigeminal ganglion. Yellow cells in A, B, C are neurons, which are stained with antibody against PGP 9.5. H: The quantification of CD11c-IR cells in JNC, the results were expressed as percentages of CD11c-IR cells in relation to MHC II–IR cells. Scale bars represent in A, B, C: 20 μm, in D, E: 50 μm.
