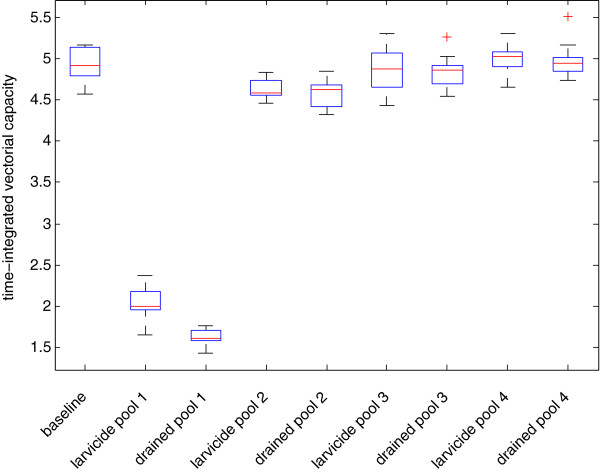
Figure 4.

Plot of time series of simulated time-integrated vectorial capacity for the baseline 2005 scenario (black), as well as source reduction in Pool 1. The scenarios of larvicide application (red) and pool draining (blue) are shown. Individual model replicates are thin lines, and the thick lines represent the average of ten replicates.
