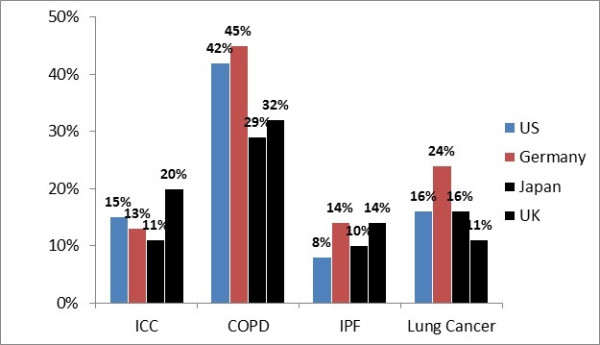
Figure 2.

Percentage of chronic cough case load ascribed to the different diagnoses is shown on the Y axis. Self-completion form allowed for ‘other’ category and hence total does not sum to 100%.

Percentage of chronic cough case load ascribed to the different diagnoses is shown on the Y axis. Self-completion form allowed for ‘other’ category and hence total does not sum to 100%.