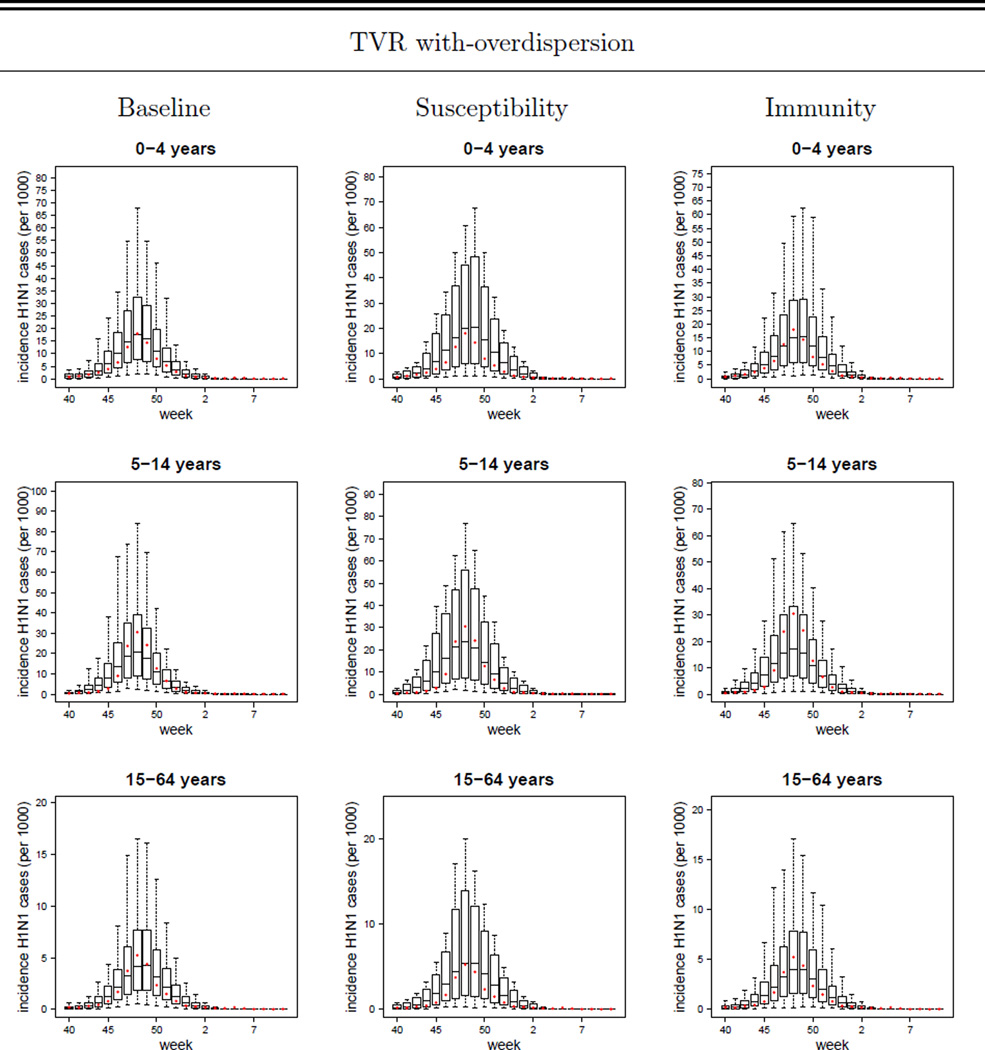
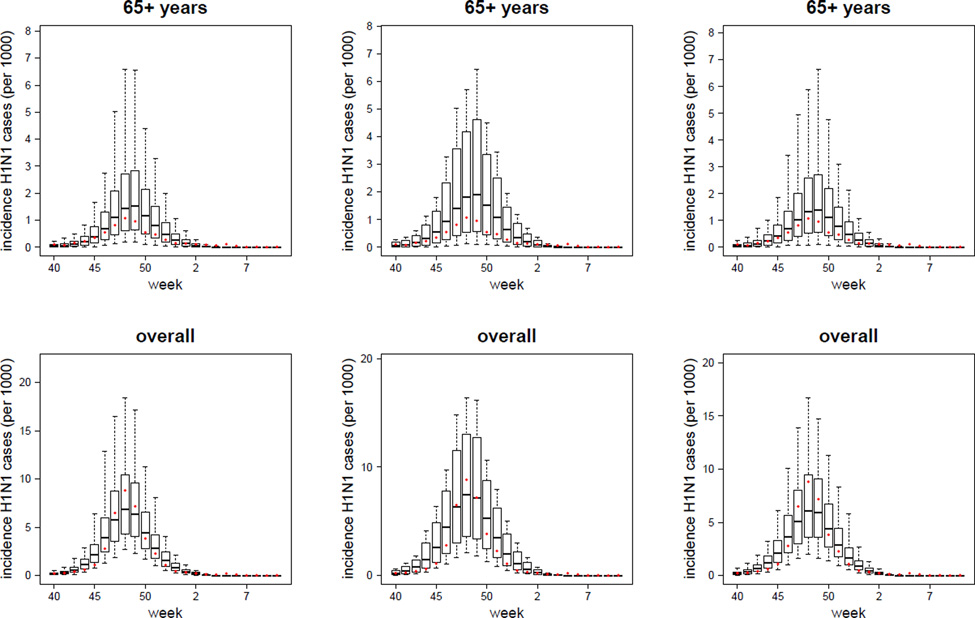
Figure 3.
TVR with-overdispersion models (Baseline, Susceptibility and Immunity variants): plot of the mean, 95%CI, maximum and minimum simulated weekly reported incidences (per 1000) of symptomatic H1N1 cases (i.e. ILI & H1N1 cases) in the 0 – 4, 5 – 14, 15 – 64, 65+ years age-classes and in the overall population. The dots represent the observed data (i.e. the H1N1-attributable ILI incidence curve). TVR: Time-Varying Reporting, i.e. age-specific and time-dependent reporting rates as defined by the piecewise linear function given in Eq. (25).


