Figure 2.

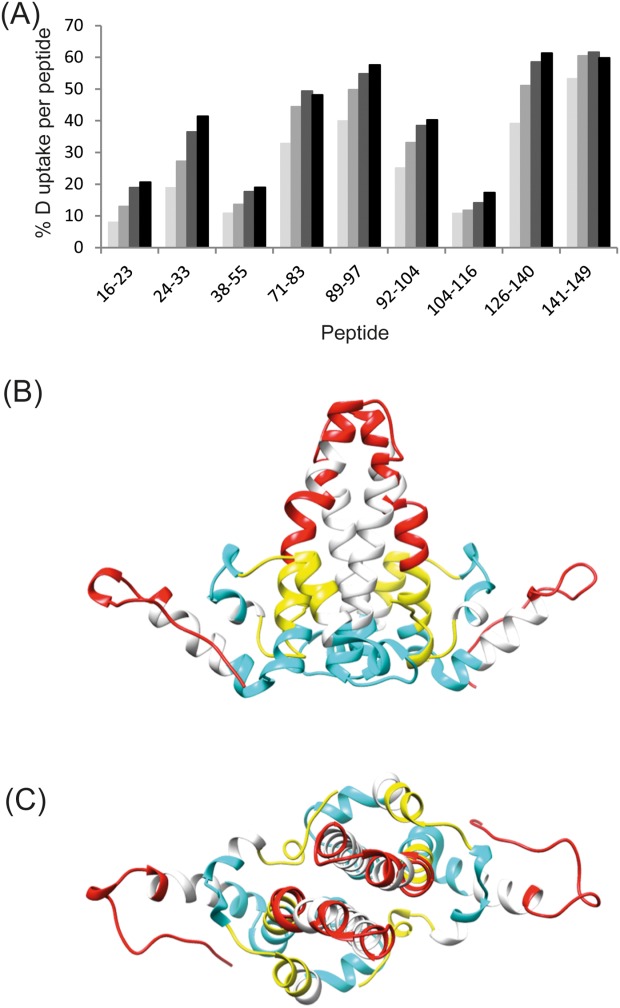
Deuterium uptake in Cp149d. A: The % of deuterium incorporation for peptides spanning the Cp149 sequence at increasing deuterium exposure times of: 1 min (pale gray), 10 min (medium gray), 60 min (dark gray), and 240 min (black). B,C: The deuterium uptake represented on the crystal structure of Cp149d indicating regions that exhibit a high- (indicated in red), medium- (indicated in yellow), and low- (indicated in blue) level of relative deuterium incorporation. The deuterium incorporation of the regions indicated in white are unknown since no peptides were observed.
