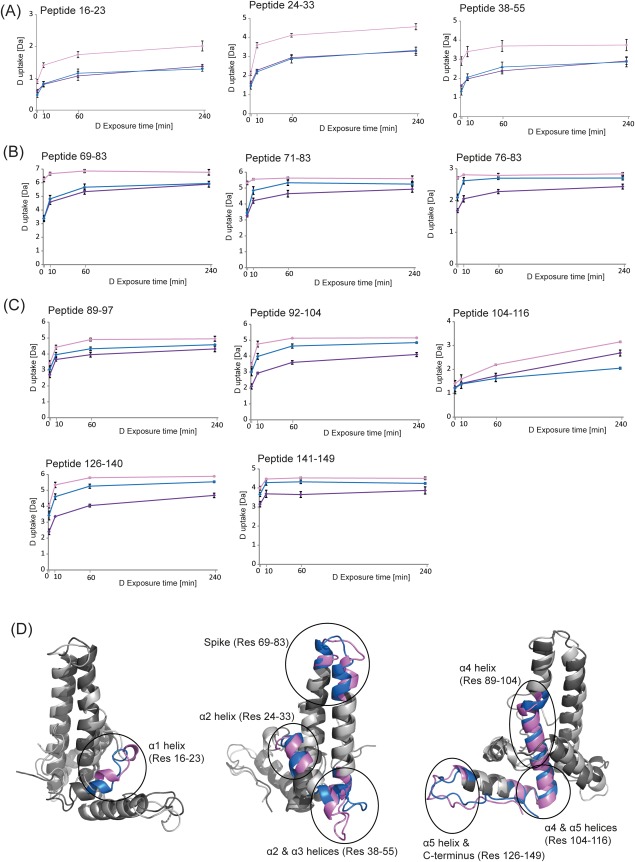
Figure 5.
Comparison of the hydrogen exchange kinetics of Cp149d (indicated in blue), Cp(−10)149d (pink), and reduced Cp(−10)149d (purple) with increasing deuterium exposure time. A: Peptides representing the N-terminal half of the protein; (B) peptides representing the “spike” region; (C) peptides representing the C-terminal half of the protein; (D) overlay of the crystal structures of the monomeric subunits of Cp149 (indicated in blue) and Cp(−10)149 (indicated in pink), illustrating the structural differences between the two proteins.

