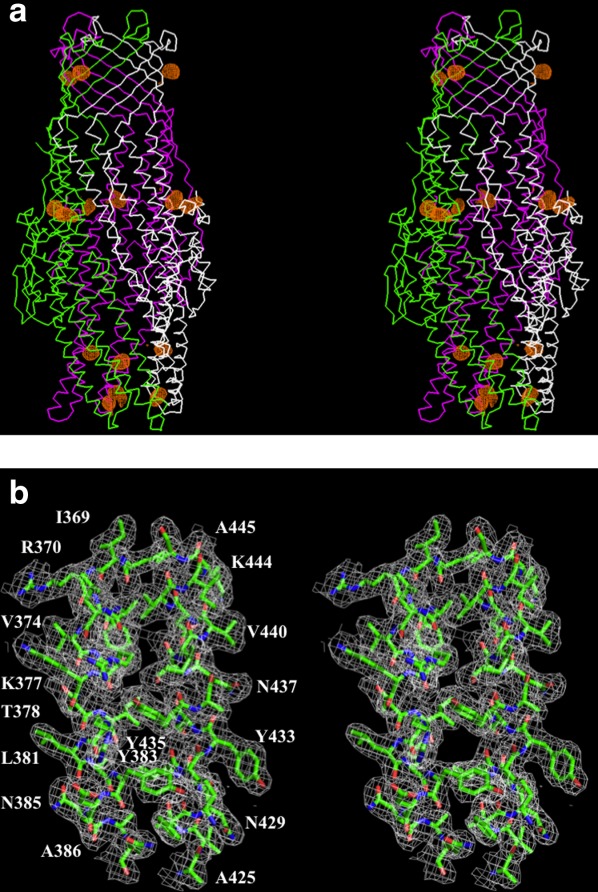
Figure 1.

Stereo view of the experimental electron density map of the CmeC channel at a resolution of 2.37 Å. (a) Anomalous maps of the 15 selenium sites (contoured at 4 σ). The selenium sites corresponding to the five methionines from each protomer of the CmeC trimer are in orange. The Cα traces of CmeC are in green, magenta, and white, respectively. (b) Representative section of the electron density at the interface between H8 and H9 of the periplasmic domain of CmeC. The electron density (colored white) is contoured at the 1.2 σ level and superimposed with the final refined model (green, carbon; red, oxygen; blue, nitrogen). An interactive view is available in the electronic version of the article.
