
Figure 2.
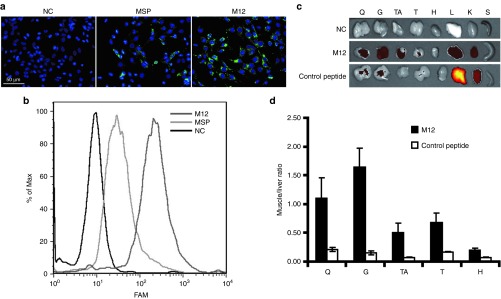
Validation of M12 peptide in vitro and in vivo. (a) Uptake of FAM-labeled M12 peptide in C2C12 cells. Fifty micromole FAM-labeled M12 and MSP peptides were coincubated with C2C12 cells, respectively, and images were taken 2 hours later (scale bar = 50 µm). NC stands for negative control (untreated cells). (b) Quantitative analysis of cellular uptake of M12 and MSP peptides in C2C12 cells by fluorescence-activated cell sorting. (c) In vivo distribution analysis of FAM-labeled M12 peptide by IVIS imaging system. Q, G, TA, T, H, L, K, and S represent quadriceps, gastrocnemius, tibialis anterior, heart, liver, kidney, and spleen, respectively. NC represents negative control (untreated mdx controls). (d) Quantitative assessment of muscle to liver ratio in vivo compared to a nonmuscle homing control peptide. To calculate the fluorescence ratio of muscle to liver, the fluorescence of each tissue was measured with IVIS imaging system and the intensity was calculated based on the default equation from the system. Then the fluorescence ratio of muscle to liver was obtained by dividing the fluorescence intensity of liver with that of each skeletal muscle, respectively (n = 3). FAM, 6-carboxyfluorescein; MSP, muscle-specific peptide.