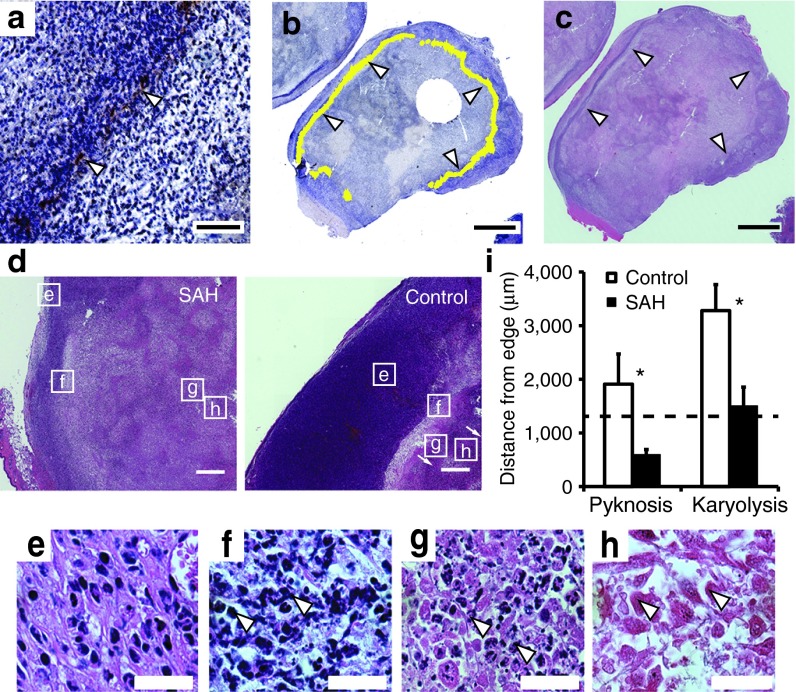
Figure 4.
Location of SAH and necrosis in tumor tissue. (a) Band of SAH (brown, white arrows) in 4T1 tumor in a BALB/c mouse. Bar = 200 µm. (b) Ring of SAH (false-colored in yellow, white arrows) around the periphery of a 4T1 tumor. Bar = 4 mm. (c) Transition zone between proliferating cells and necrosis (white arrows). Bar = 4 mm. (d) H&E stained tumors showing transition from viable (e) to necrotic cell types (f, pyknosis; g, karyorrhexis; and h, karyolysis) in EC-SAH-treated and EC-ZsG-treated (control) mice. Bars = 500 μm. (e–h) High-resolution micrographs of (e) proliferating cells, (f) pyknosis (arrows indicate nuclear condensation), (g) karyorrhexis (arrows indicate nuclear fragmentation), and (h) karyolysis (arrows indicate nuclear dissolution). Bar = 25 μm. (i) The distance from the tumor edge to regions of pyknosis and karyolysis was shorter in EC-SAH-treated mice compared to EC-ZsG-treated (control) mice (*P < 0.05). The location of karyolysis in EC-SAH-treated mice corresponded to the location of SAH (1.31 mm; dashed line). H&E, hematoxylin and eosin; SAH, Staphylococcus aureus α-hemolysin.

