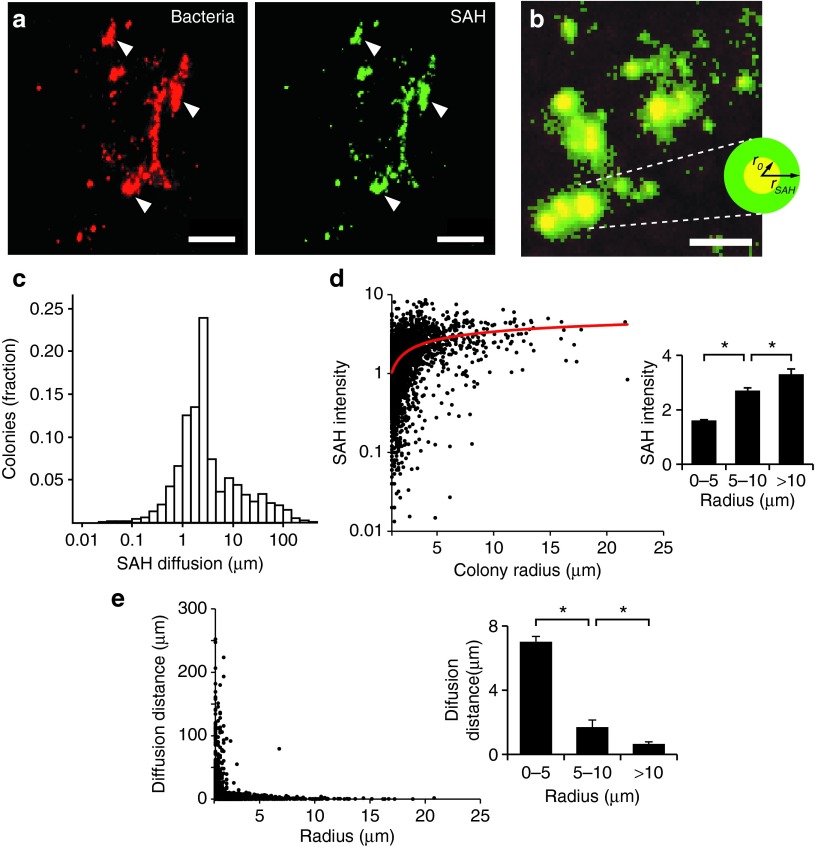
Figure 5.
Diffusion of SAH from bacterial colonies in tumors. (a) Colonies of EC-SAH (red) in a 4T1 tumor and associated SAH (green). White arrows indicate areas of colocalization between bacteria and SAH. Bars = 50 µm. (b) Diffusion of SAH (green) was quantified as the distance (rSAH) of SAH penetration into tissue away from the outer edge (r0) of bacterial colonies (red). Colocalized pixels appear as yellow. Bar = 25 µm. (c) Distribution of SAH diffusion distances from bacterial colonies (n = 4,743). The average diffusion distance was 6.8 ± 0.3 µm. (d) SAH intensity as a function of colony size. SAH intensity was normalized by the minimum detectable level. A logarithmic fit (red line) was added as an aid to the eye. (Inset) Larger colonies produced more SAH (*P < 0.01). (e) SAH diffusion distance and colony size were inversely related. (Inset) The average distance from small colonies (r0 < 5 µm) was greater than intermediate (5 < r0 < 10 µm) and large (r0 > 10 µm) colonies (*P < 0.001). SAH, Staphylococcus aureus α-hemolysin.

