Figure 6.

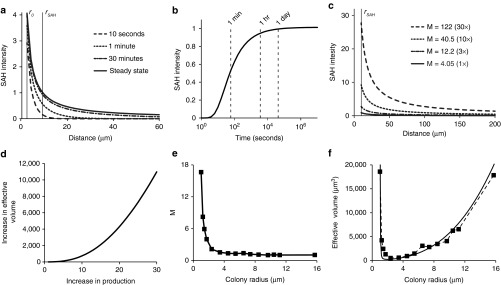
Mathematical analysis of SAH diffusion from bacterial colonies. (a) SAH concentration profiles as a function of time and distance from the center of bacterial colonies, as predicted by a mathematical model of SAH production and diffusion. SAH concentrations are normalized by the minimum detectable level. The steady-state profile describes the concentration as time becomes very large. The radii r0 and rSAH are the colony edge (2.26 µm) and the average diffusion distance (9.06 µm), respectively. (b) The concentration at r = rSAH quickly approaches steady state, being equal to 94 and 99% of the maximum value at 1 and 24 hours, respectively. (c) Effect of increasing M (dimensionless SAH production) on the concentration profile at 24 hours. Increasing M is proportional to increasing m, the SAH production rate. (d) Effect of increasing M on the volume of cells with a concentration of SAH greater than the minimum detectable level. (e) Larger colonies had lower predicted SAH production (M). Data were obtained from measured values of SAH diffusion distance (rSAH) and colony radius (r0; Figure 5e). (f) The measured effective volume of SAH (squares) had a non-linear relationship with colony size. For colonies with radii smaller than 2.4 µm, the effective volume decreased with increasing size. The effective volume increased with increasing size for colonies larger than 2.4 µm. The theoretical effective volume (solid line) is based on the approximate steady-state relationship between colony radius and SAH diffusion distance:  . M, dimensionless SAH production; SAH, Staphylococcus aureus α-hemolysin.
