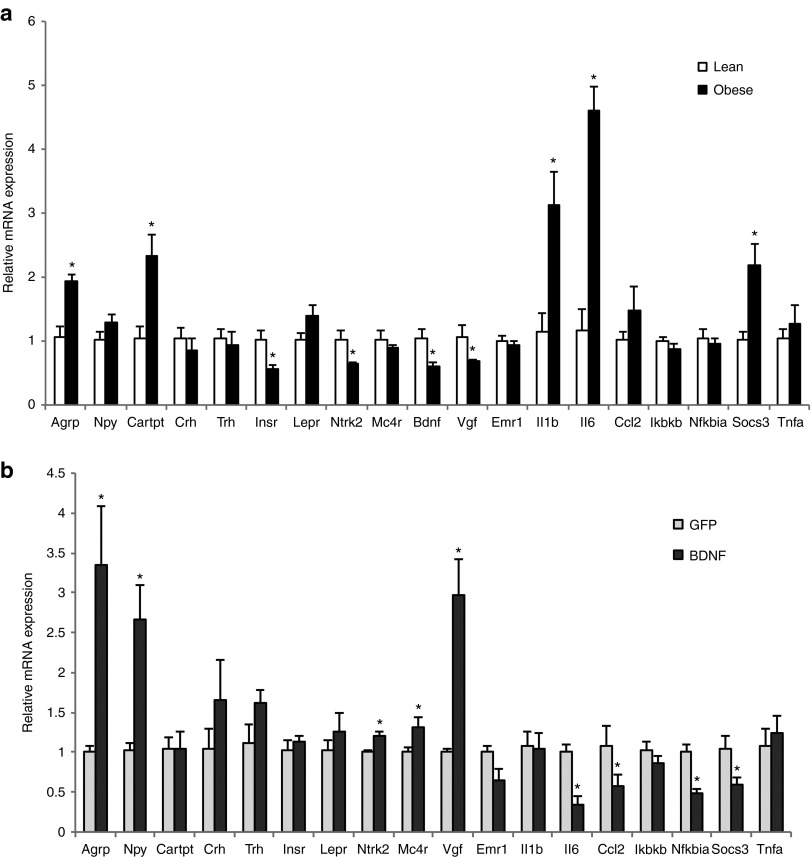
Figure 5.
Gene expression profile of the hypothalamus. (a) Gene expression profile of DIO mice compared to lean mice fed with normal diet. (b) Gene expression profile of BDNF-treated DIO mice compared to GFP-treated DIO mice. Data are mean ± SEM, n = 5 per group. *P < 0.05. BDNF, brain-derived neurotrophic factor.

