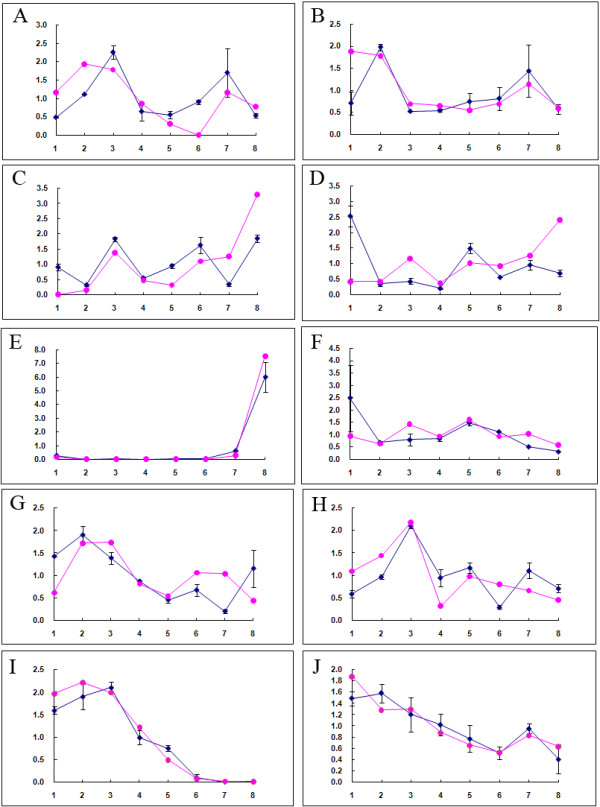
Figure 6.

RT-qPCR confirmation of expression profiles obtained by RNA-seq transcriptome analysis. Fold-change in transcript abundance obtained by both RT-qPCR and RNA-Seq are presented on the same graph for eight different genes. Representative encoding genes are shown in A-J. Lines with magenta color are data obtained by RNA-seq, and blue lines represented the validated data by RT-qPCR. A-J are sucrose-phosphate synthase, trehalose 6- phosphatase, beta-D-xylosidase 4, glucose-1-phosphate adenylyltransferase, polygalacturonase, beta-fructofuranosidase, protein phosphatase 2C-1/PP2C-1, protein phosphatase 2C-2/PP2C-2, YABBY-1, YABBY-2 respectively.
