
Fig. 1. UVA-induced lysosomal changes in human Hs27 skin fibroblasts are mimicked by pharmacological inhibition of cathepsin B.
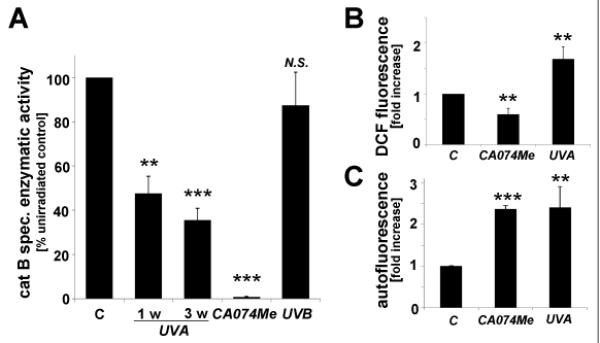
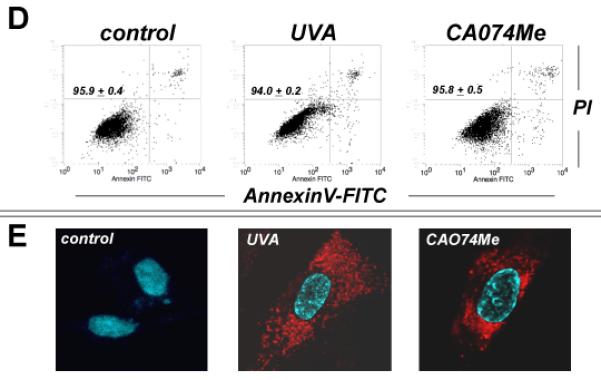


(A) Cathepsin B specific enzymatic activity in Hs27 cells exposed to UVA (‘1 week’ regimen: 39.6 J/cm2 total dose; ‘3 week’ regimen: 59.4 J/cm2 total dose), UVB (1 week regimen: 100 mJ/cm2 total dose), or CA074Me (1μM, q.d., 4 consecutive days) (n≥3, mean ± SD). (B) Cellular oxidative stress as determined by flow cytometric analysis of DCF-fluorescence in UVA-exposed (‘1 week’ regimen) and CA074Me-treated (as specified in A) cells (n≥3, mean ± SD). (C) Cellular autofluorescence intensity as determined by flow cytometric analysis ((groups as in B; n≥3, mean ± SD). (D-G) After exposure to chronic UVA (‘3 week’ regimen), CA074Me (as specified in A), or mock treatment, cells were analyzed for: (D) viability as examined by flow cytometric analysis of annexin V-propidium iodide-stained cells; (E) cellular autofluorescence as visualized by confocal microscopy; (F) occurrence of osmiophilic vesicles as visualized by transmission electron microscopy [L (osmiophilic vesicles indicative of lysosomal lipofuscin accumulation); M (mitochondrion); N (nucleus)]. (G) lysosomal staining (Lysotracker Red) as visualized by confocal microscopy; nuclear counterstain: DAPI. (H) Cellular Lamp-1 protein levels in response to CA074Me (as specified in A) or UVA exposure (‘1 week’ and ‘3 week’ regimen) as examined by immunoblot analysis. (I) LAMP-1 mRNA levels in Hs27 cells exposed to UVA (‘3 week’ regimen) or CA074Me as determined by real time RT-PCR analysis (mean ± SD, n=3).