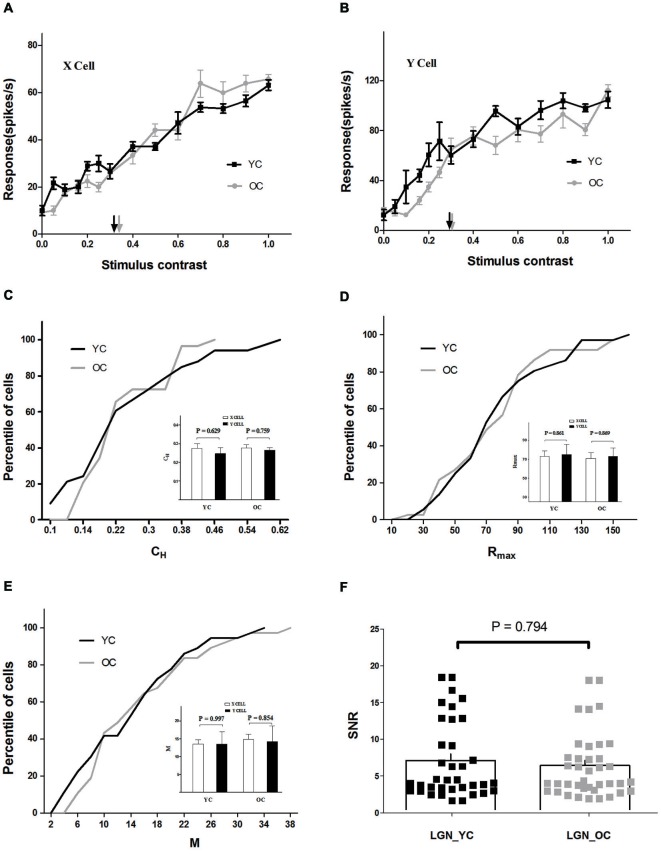
Figure 1.
Contrast response properties of lateral geniculate nucleus (LGN) neurons in young and old cats. (A) Contrast response functions of typical young cats (YC) (black) and old cats (OC) (gray) X cells. Each point represents the response to the stimulus at a given contrast. The half maximal contrast (CH) is marked with black (YC) and gray (OC) arrows. (B) Contrast response functions of typical young (black) and old (gray) Y cells in the same format as (A). The population results of CH, Rmax, and M values are illustrated in C, D, and E. Comparison of each parameter between X and Y cells, in young and old cats, is shown on the inset plots in C, D, and E. Black and gray lines represent the data which combined X and Y cells of young and old cats, respectively. (F) Distribution of signal-to-noise ratio (SNR) values in LGN for young (black squares) and old (gray squares) cats. The histograms indicate the mean value of SNR values in each group. Error bars indicate SEM. The same abbreviations are used in subsequent figures.

