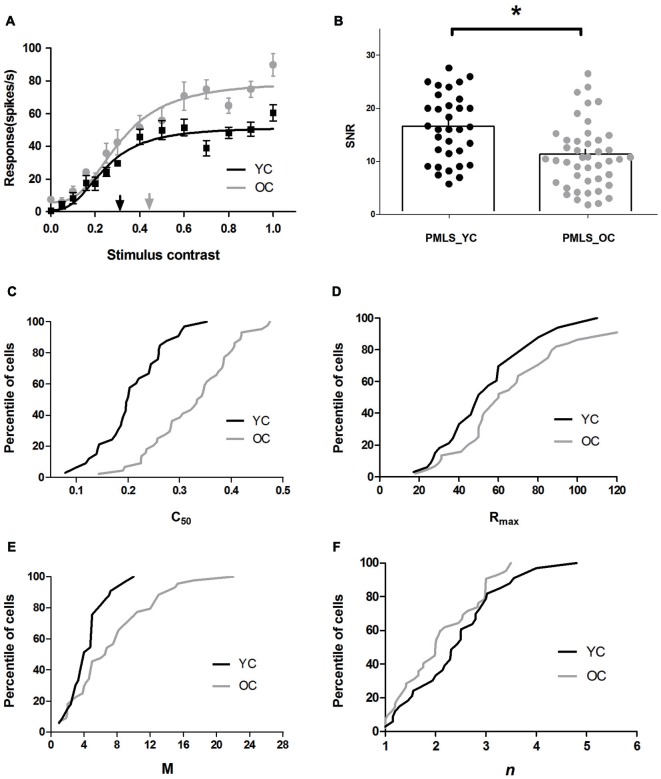
Figure 3.
Contrast response properties of posteromedial lateral suprasylvian cortex (PMLS) neurons in young and old cats. (A) Sample CRF curve fits for PMLS neurons in the same format as in Figure 2A. (B) Distribution of SNR values in area PMLS for young (black dots) and old (gray dots) cats, and mean values (histogram) of SNR values are illustrated. Percentile of PMLS neurons with given C50, Rmax, M, and n values are shown in panels C, D, E, and F, where black and gray lines represent the data of young and old cats, respectively. Error bars indicate SEM.

