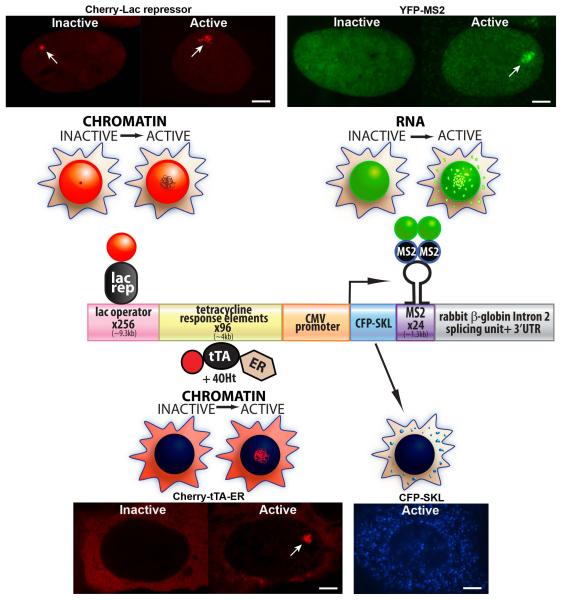
Figure 1.
Molecular and Cellular Characterization of the Single-Cell Imaging System The diagram of the single-cell imaging transgene shows the modular organization of its sequence components. The proteins, which permit the analysis of DNA and RNA in single living cells, are shown in association with the sequence elements to which they bind. The cell diagrams above each factor depict their localization patterns in inactive and activated cells. The cell images are of the U2OS cell line (2-6-3), which contains a multi-copy array of the CMV promoter regulated transgene. Cherry-lac repressor allows the transgene to be visualized in both the inactive (condensed) and active (deccondensed) states. Transcription is induced from the minimal CMV promoter by the activator, Cherry-tTA-ER, which is composed of the tetracycline transactivator (tTA) fused to Cherry and the estrogen receptor (ER) hormone-binding domain. Cherry-tTA-ER is retained in the cytoplasm until 4-hydroxytamoxifen (4-OHT) induces its entry into the nucleus where it accumulates at the transgene array and activates transcription. The transcription unit encodes Cyan Fluorescent Protein (CFP) fused to a peroxisomal targeting signal (SKL), MS2 bacteriophage translational operator repeats, and the intron 2 splicing unit of the rabbit β-globin gene. In inactive cells, YFP-MS2 is diffusely distributed in the nucleus. Upon activation, YFP-MS2 binds to the MS2 stem loop structure in the transcribe RNA both at the transcription site and throughout the nucleus. The enrichment of the protein product, CFP-SKL, in the peroxisomes provides real-time confirmation that all of the steps required for gene expression have been successfully completed. Scale bars =5 9m.

