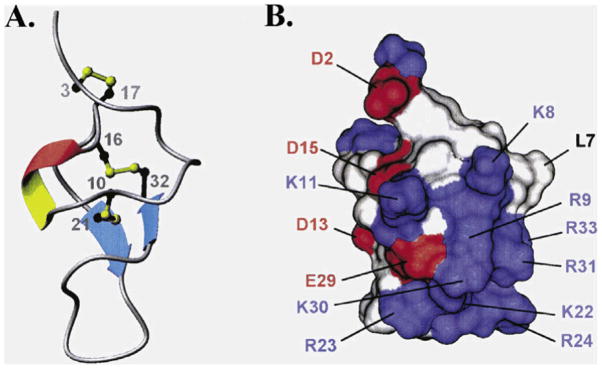
Figure 3. Structure of IpTxa.

(A) Schematic diagram of IpTxa, illustrating the location of the β strands (blue), the 310 helical turn (red), and the disulfide bridges (yellow). (B) Profile of surfaces, negatively charged residues (acid) are shown in red, positively charged residues (basic) are shown in blue, and the residues not charged or hydrophobic are in white (Figure taken from Lee et al., 2004).
