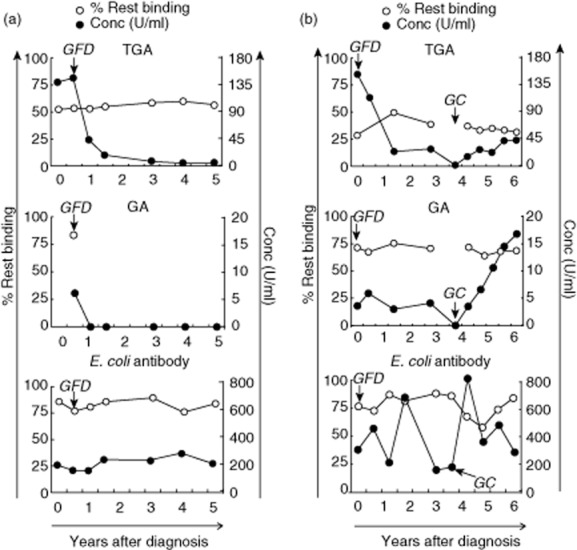
Fig. 4.

The effect of gluten-free diet or gluten challenge on antibody avidity. Two representative patients are depicted that show a drop in transglutaminase-2 (TG2) antibodies (TGA) and gliadin (GA) immunoglobulin (Ig)A concentration after start of the gluten-free diet (GFD) (a,b) and a rise again after gluten challenge (GC) (b). The first time-point is the diagnostic sample. The avidity of the shown antibody responses, expressed as the percentage of rest binding, remains similar during changes in concentration. Avidity (% rest binding) is shown by white circles, antibody concentration by black circles. Information is shown on IgA antibodies recognizing TGA2, GA and Escherichia coli.
