
Fig. 5.
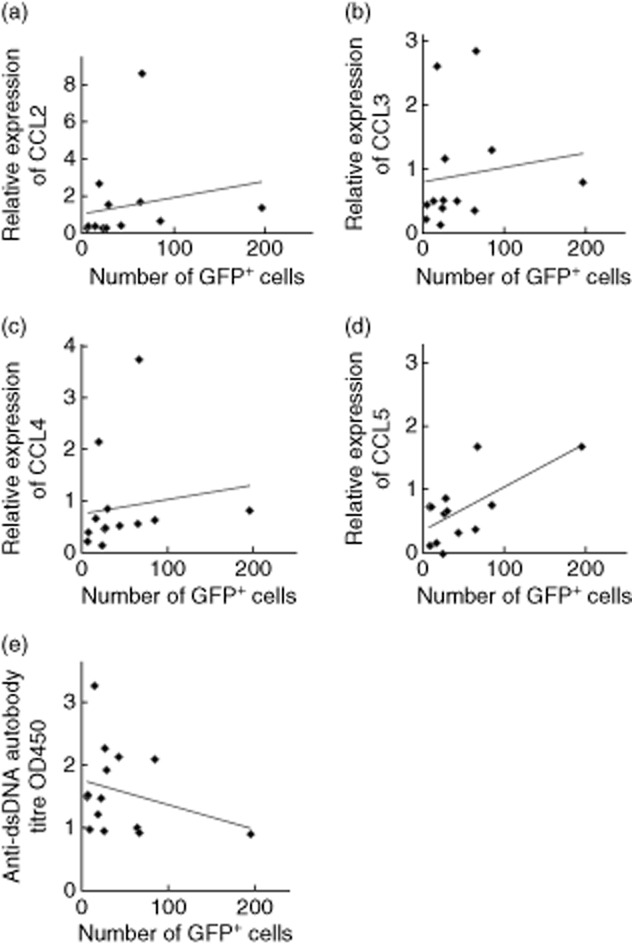
Correlation between the numbers of infiltrated inflammatory cells in kidneys and the expression levels of chemokines and anti-dsDNA autoantibody titres in MRL/lpr mice.(a) Correlation between the number of infiltrated inflammatory cells in kidneys and the expression level of chemokine (C-C motif) ligand (CCL)2 (r = 0·62, P = 0·015). (b) Correlation between the number of infiltrated inflammatory cells in kidneys and the expression level of CCL3 (r = 0·46, P = 0·052). (c) Correlation between the number of infiltrated inflammatory cells in kidneys and the expression level of CCL4 (r = 0·5, P = 0·041). (d) Correlation between the number of infiltrated inflammatory cells in kidneys and the expression level of CCL5 (r = 0·51, P = 0·037). (e) Correlation between the number of infiltrated inflammatory cells in kidneys and anti-dsDNA autoantibody titres at a 1:200 dilution (r = −0·22, P = 0·211).