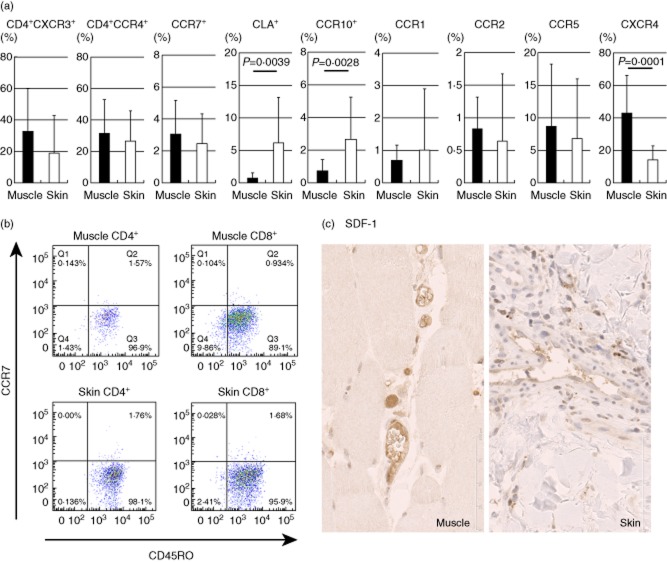
Fig. 3.
Chemokine receptor expressions of T cells expanded from muscle lesions (closed) and skin lesions (open) in dermatomyositis (DM) and polymyositis (PM) patients (n = 24). (a) Numbers indicate mean percentages of total T cells. Mean values ± standard deviation (s.d.) are indicated. (b) Representative fluorescence activated cell sorter (FACS) dot-plots of CD45RO and CCR7. (c) Immunohistochemistry of muscle and skin lesions with antibodies against stromal-derived factor (SDF)-1, original magnification ×400.

