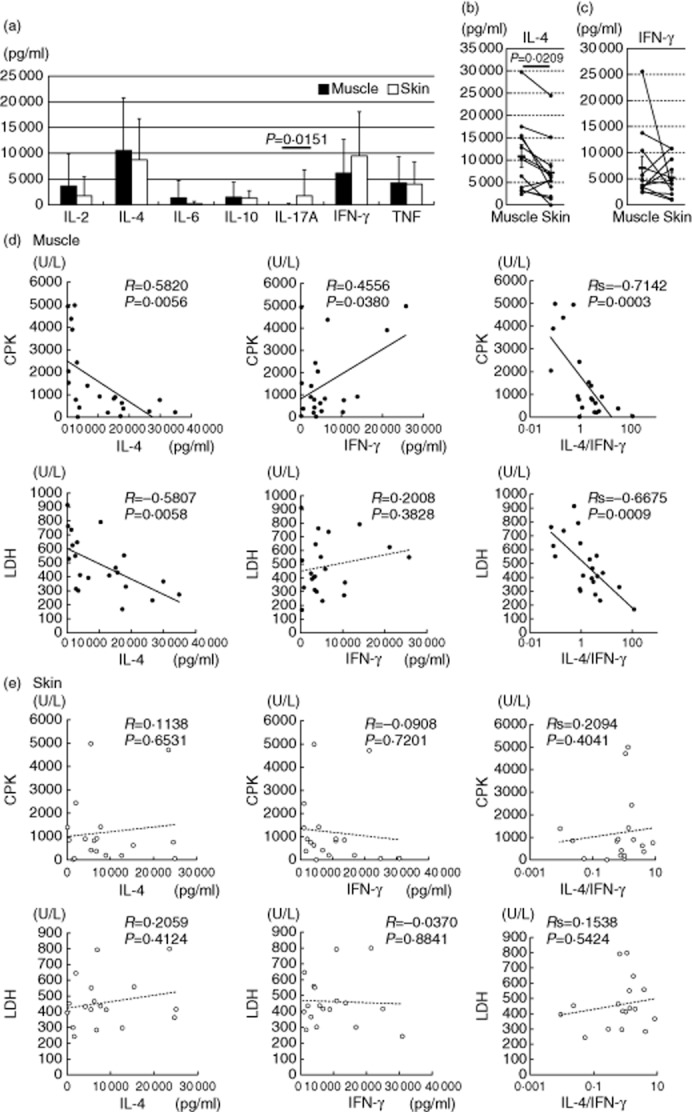
Fig. 4.

Cytokine production patterns of the tissue-infiltrating T cells. (a) Cytokine concentrations in the culture supernatants from anti-CD3 antibody-stimulated expanded T cells (n = 28). Mean values ± standard deviation (s.d.) are indicated. (b,c) Interleukin (IL)-4 and interferon (IFN)-γ concentrations in the supernatants from the stimulated muscle (closed)- and skin (open)-derived T cells in the same patients. (d,e) Correlation between cytokine levels and clinical parameters in the muscle- and skin-derived T cells.
